How the three financial statements fit together
A public company files three financial statements because there are three different questions worth asking about it, and no single table answers all three. The balance sheet asks what it owns and owes at one instant. The income statement asks whether it made a profit over a span of time. The cash flow statement asks where the money actually moved over that same span. One is a photograph. The other two are films of the stretch between photographs.
They lock together at two joints. First, profit earned during the period lands inside equity on the next balance sheet, so the bottom line of the income statement moves the bottom right corner of the balance sheet. Second, the cash flow statement's own bottom line is the change in the balance sheet's cash line between the two photographs, which means every dollar it describes has to land somewhere visible. Learn those two joints and the filings stop being three unrelated tables. This post walks the map, and covers the one thing the joints cannot check for you.
This is the ground floor of a series building up the vocabulary our screens use. Every ratio that comes later is assembled from line items on one of these three statements.
Three questions, three statements
The tense of the heading tells you which kind of statement you are looking at. A balance sheet is titled "as of" a date. An income statement and a cash flow statement are titled "for the period ended."
The balance sheet is a stock measure: a snapshot of the company's financial position at the close of business on one day. It obeys one equation, which is where double-entry bookkeeping shows up in public:
assets = liabilities + equityEverything the company controls sits on the left. Every claim against it sits on the right, creditors first, owners last. Equity is the residual: what would be left for shareholders if assets were converted at their carrying values and every creditor paid. That residual framing is the basis of the deep-value screens, taken to its extreme in the article on net current asset value.
The income statement is a flow measure: revenue at the top, costs subtracted in layers, net income at the bottom. It is built on accruals, meaning revenue is recorded when earned and costs when matched to that revenue, whether or not cash changed hands. Accrual accounting exists for good reasons. It also means net income is a number assembled from judgment calls.
The cash flow statement is a flow measure over the same span, split into three sections: operating (running the business), investing (buying and selling long-lived assets), and financing (raising and returning capital). It exists because the income statement will not tell you whether the profit was collected.
The first joint: profit becomes equity
Net income does not vanish at the bottom of the income statement. It is added to retained earnings, a component of equity on the balance sheet. Dividends and buybacks subtract from it. Share issuance adds to a different part of equity.
That single wire explains a lot of what you see on a screen. A company that earns and does not pay it all out has a book value that climbs; a long enough run of losses can push equity below zero. Equity is a cumulative ledger of every period's profit that was never distributed, which is why a balance sheet encodes a company's whole history while an income statement covers one period of it.
One caveat that trips up people reconciling it by hand: not every change in equity passes through net income. Currency translation on foreign subsidiaries and certain pension remeasurements land in equity directly, through other comprehensive income. So the reconciliation is closer to prior equity, plus net income, minus dividends and buybacks, plus issuance, plus or minus other comprehensive income. When your arithmetic misses by a few percent, that last term is usually where it went.
The second joint: the cash flow statement explains the cash line
Add the three sections of the cash flow statement together, adjust for the effect of exchange rates, and you get the change in the cash balance between the opening and closing balance sheets. That is the tightest cross-check in the whole filing, and it is not optional: the statement is constructed to close.
It helps to know how it gets built. The operating section usually starts at net income and works backwards, adding back non-cash charges like depreciation and stock-based compensation, then adjusting for working capital movements taken straight off the two balance sheets: receivables that grew, inventory that piled up. The distance between the top of that section and its subtotal is the accrual content of reported earnings, laid out line by line for you.
That is why the gap between operating cash flow and net income is the cheapest earnings-quality test there is, and why free cash flow is the number hardest to fake: it is stitched from two sections of a statement that has to reconcile to a balance sheet line.
Where a screen reads each one
Open any 10-K or 10-Q on SEC EDGAR and the three statements sit together in the financial statements section, in that order, followed by the notes. Every raw field a Quantery thesis reads comes from one of them:
- Income statement:
revenue,net_income,interest_expense,income_tax_expense. - Balance sheet:
total_equity,total_liabilities,cash,inventory,current_assets,current_liabilities,total_debt. - Cash flow statement:
operating_cash_flow,capex,dividends_paid,buybacks,depreciation_amortization.
The local data lake stores one row per company per filing period, and the columns of that row are those line items. There is no vendor rating in between. A number on a scorecard traces back to a column, and the column traces back to a filing.
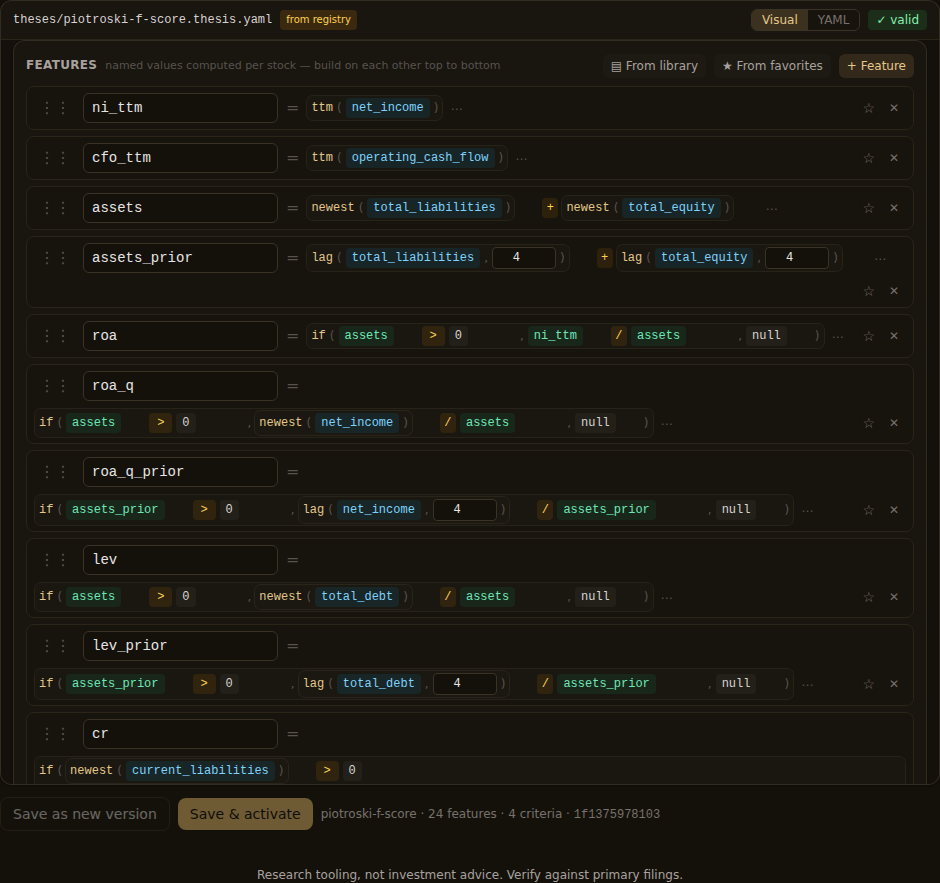
You can see the wiring in the bundled Piotroski F-Score template, whose features are named calculations built out of those columns.
Never mix periods across a joint
Look closely at that third feature: assets is defined as newest(total_liabilities) + newest(total_equity). The lake does carry a total_assets column, but it was added after early lakes were built, so older rows can sit empty until a re-pull. Rebuilding the number from the identity gives the screen dependable coverage back through the history, and it works because the identity holds inside any single filing.
It stops working the moment you cross periods. newest() returns the most recent filing's value and nothing else. The looser latest() scans backwards until it finds one, and using it here would add this quarter's liabilities to last quarter's equity. The sum would still be a number. It would describe a balance sheet that never existed at any moment in time. So the template uses the strict form, and a filing missing either term produces a null.
The same discipline runs through the year-over-year features, which use lag(field, 4) to compare a quarter against the same quarter a year earlier. It is the point-in-time habit applied inside one company's history, and it is why an honest backtest reads filings by their filing date rather than their period date.
What the joints cannot check
Here is the limit worth carrying away. The three statements are internally consistent by construction, so their agreement tells you nothing about what was left out of them. The joints are a check on arithmetic. They are not a check on scope.
Enron is the case study. The Senate Permanent Subcommittee on Investigations, reviewing an October 2000 presentation to Enron's board, reports that the Finance Committee was told Enron had a total of $60 billion in assets, of which about $27 billion, or nearly 50 percent, were lodged with the company's unconsolidated affiliates. The same report notes a $1.2 billion reduction in shareholder equity disclosed in October 2001, arising from an accounting methodology the company's auditor had advocated and later decided was in violation of generally accepted accounting principles.
Every balance sheet Enron filed in those years balanced. The joints held. What the statements did not show was the roughly half of the asset base sitting outside the consolidation boundary, because the boundary itself was the accounting question, and the boundary is described in the notes.
No screen reads notes. That is a real limitation of screening, and the right response is to know what the arithmetic covers. A screen sorts the market down to a list short enough that you can go read the footnotes yourself.
Screening across all three at once
The payoff of knowing the map is that you can write a rule that touches all three statements in one thought. The shape below is illustrative, and the bundled templates are the reference for exact fields, but this is the idea:
# "The three statements agree with each other" - illustrative
params:
  conversion_floor: 0.8       # cash should back up reported profit

features:
  ni_ttm:        ttm(net_income)             # income statement
  cfo_ttm:       ttm(operating_cash_flow)    # cash flow statement
  equity_now:    newest(total_equity)        # balance sheet
  equity_prior:  lag(total_equity, 4)        # same quarter, a year back
  assets:        newest(total_liabilities) + newest(total_equity)
  conversion:    if(ni_ttm > 0, cfo_ttm / ni_ttm, null)
  equity_growth: if(equity_prior > 0, equity_now / equity_prior - 1, null)

criteria:
  cash_backs_profit:
    - { when: "conversion >= $conversion_floor", score: 2 }
    - { when: "conversion >= 0.5",               score: 1 }
    - { else: 0 }
  profit_reaches_book:
    - { when: "equity_growth > 0", score: 1 }
    - { else: 0 }

gate:
  - ni_ttm > 0
  - assets > 0                 # no balance sheet, no score
conversion walks the second joint: does the cash flow statement back up the income statement? equity_growth walks the first: did the reported profit turn up in book value? The Piotroski template runs its own version of that second check.
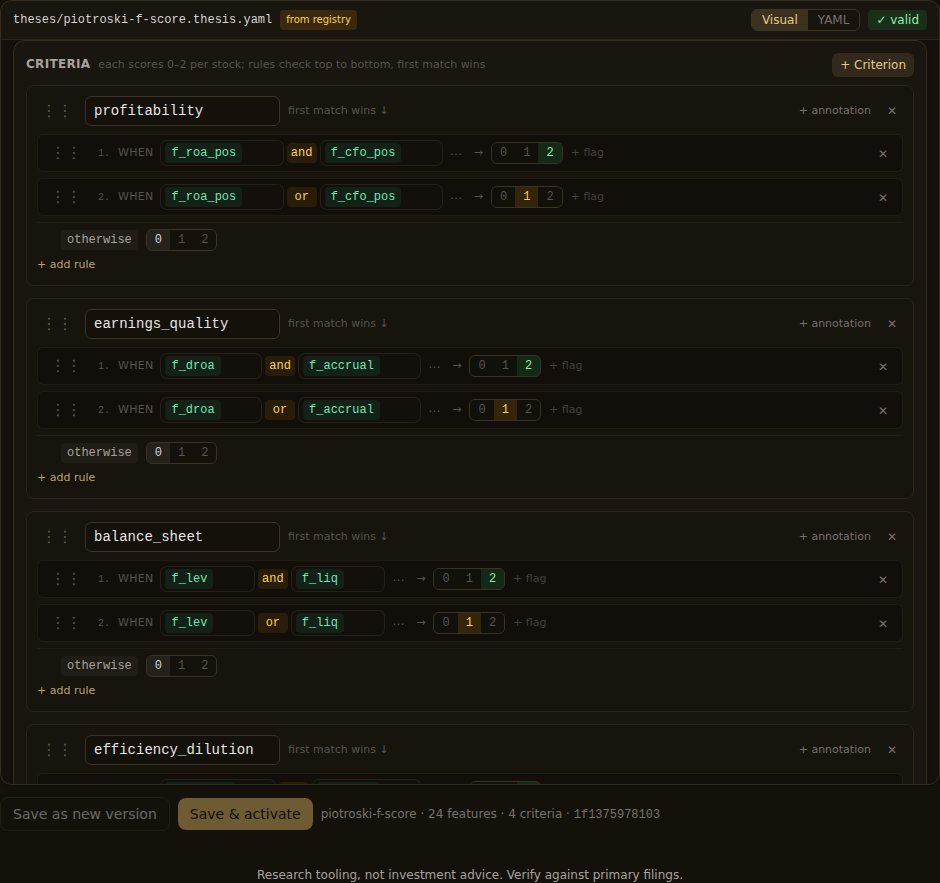
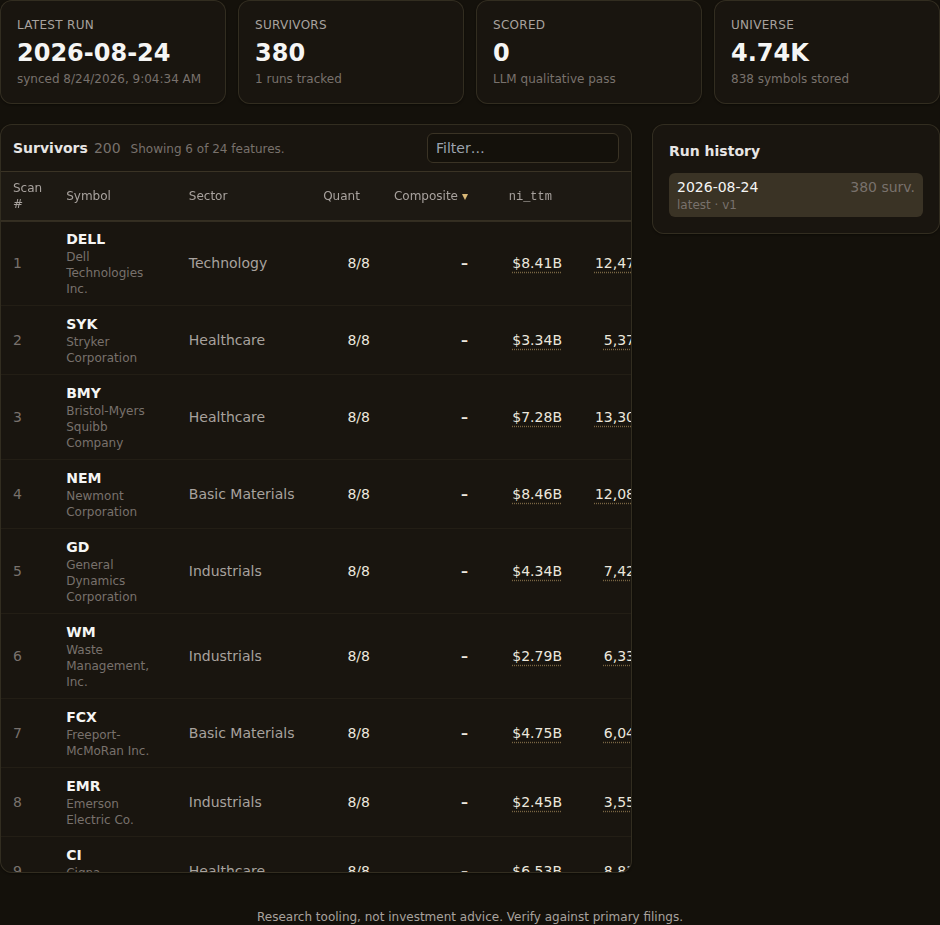
Run it and you get US equities sorted by rules you can read. We ran the bundled Piotroski F-Score template on our own install on 24 August 2026, against point-in-time fundamentals, and 380 names cleared its gate of at least seven of eight signals. That is a reading list. The numbers behind every row are one click from the filings they came from.
If you have not run a screen before, the ten-minute walkthrough is the fastest way to watch a scorecard trace back to a filing. And once the three statements are a map you can hold in your head, the next question is which numbers on them a thesis is allowed to trust: filed and trailing, or estimated and forward. That is where this series goes next.
Research tooling, not investment advice. Nothing here is a recommendation to buy, sell, or hold any security. Screens, scores, and backtests are informational only; backtested results are hypothetical, exclude costs such as commissions and slippage, and do not guarantee future results. Verify against primary filings and make your own decisions.
Want to try this on your own rules? Quantery is free for 14 days: the full app, no card required.
← All articles