How to audit a stock screen result
To audit a stock screen result, trace the gate decision to the criterion rule that matched, then trace each feature value to the inputs, fiscal periods, and filing dates used to calculate it. Treat the final score as a starting address. Confirm that the calculation used the data you expected.
In Quantery, start with the recorded run and its saved thesis version. Open the gate explanation, inspect the matched rules, and keep following each calculated feature until you reach stored source data. If the recorded value differs from a live re-evaluation, treat them as separate observations. That sequence turns a plausible-looking row into a result you can challenge and reproduce.
Start with the gate
A survivor is a company whose result passed the thesis gate. Before reading anything about the company, confirm which run produced that result and which thesis version the run used. A result from an older run may still be useful, but it answers a question asked with the data available then.
Next, ask what the gate actually required. A score gate may admit a company after several middling criterion scores add up. A boolean gate may depend on every required condition. A custom expression can make one feature decisive. The word PASS alone doesn't distinguish those structures.
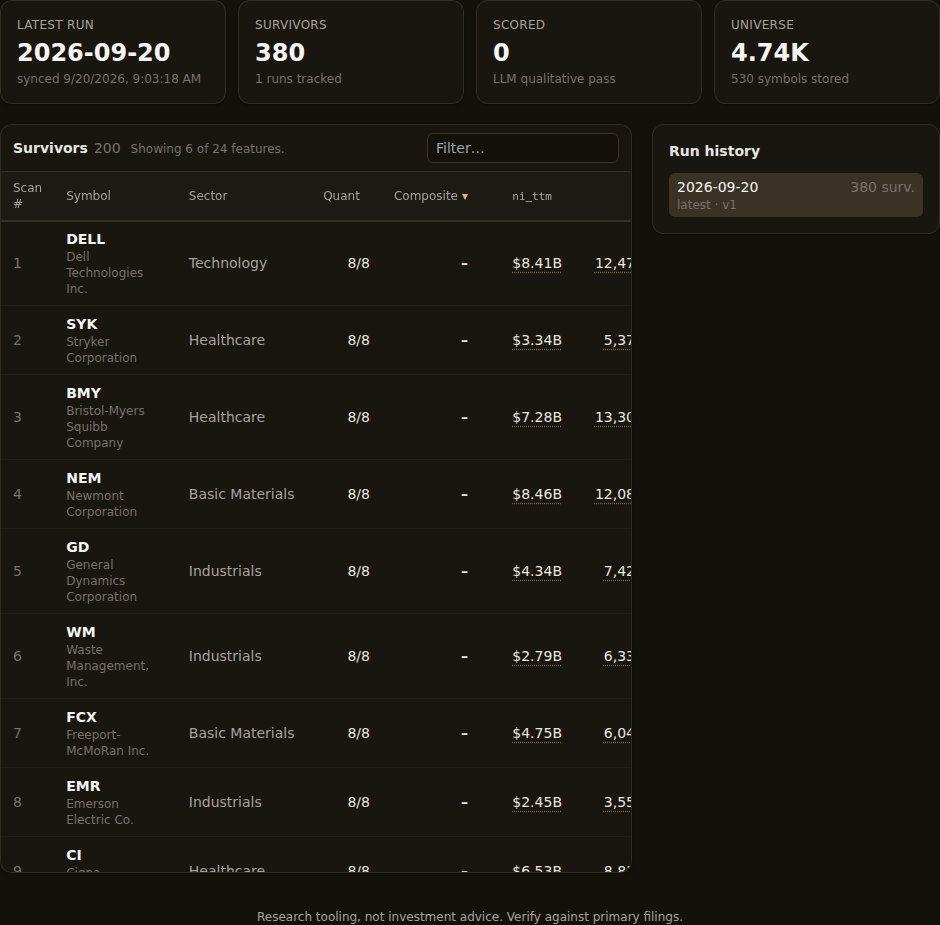
The survivors table gives you a compact starting point. Thesis feature values appear beside the score, and each visible value can open its explanation. Use the row to choose what needs inspection. The row itself is only an index into the audit.
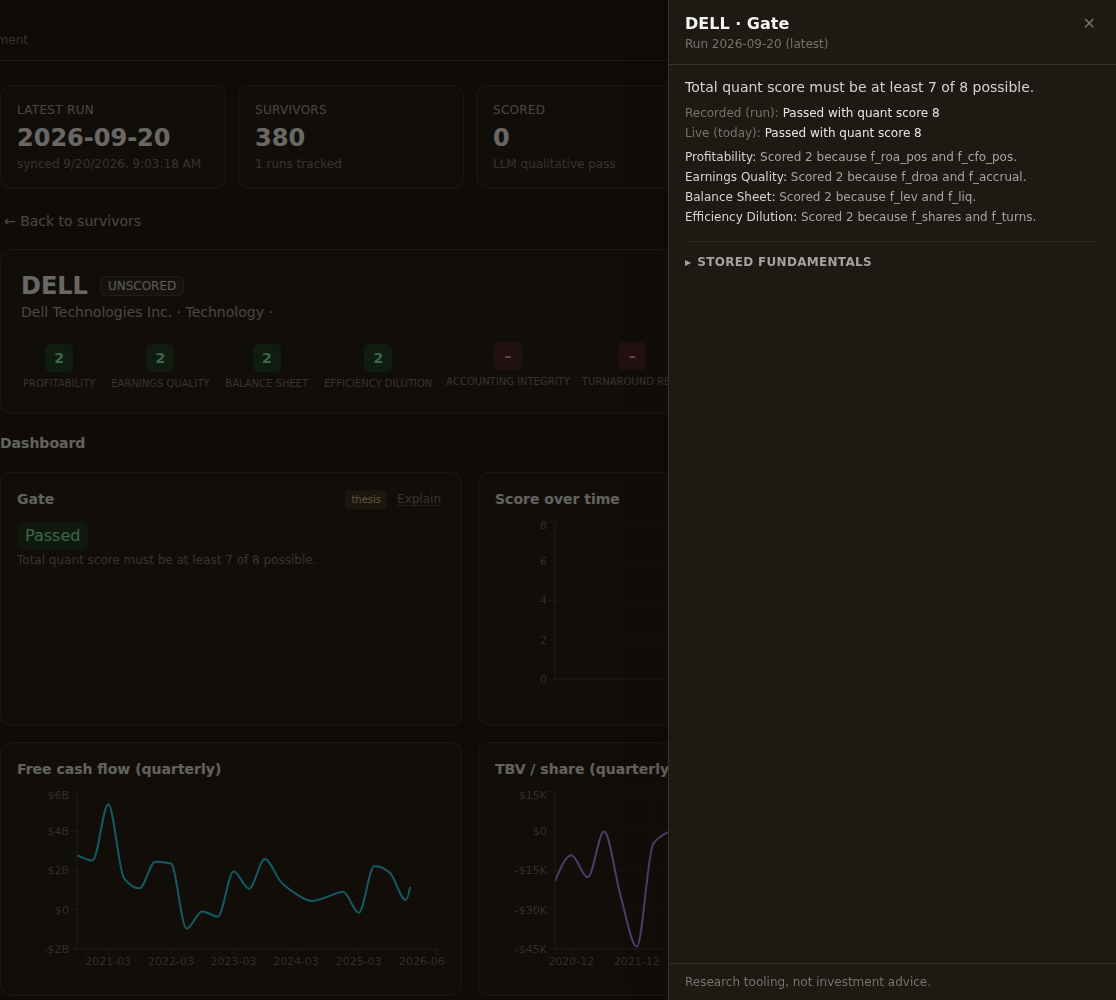
Start with an unexpected result. Open its gate explanation and answer these questions:
- Did the gate pass in the recorded run?
- What does the live evaluation say now?
- Which criteria contributed to the gate outcome?
- Did the result carry a data-quality flag?
A gate pass says that the equations cleared the declared threshold. Check separately whether the underlying business fits the story you had in mind. The audit covers that gap between equation and story.
Read the rule that matched
A criterion can contain several scoring rules. Quantery evaluates them in order, and the first matching rule wins. Rule order therefore matters as much as the thresholds themselves. A broad rule placed above a narrow one can capture a value before the lower rule is ever checked.
The explanation marks the rule that matched. It also distinguishes rules that were evaluated and didn't match from rules that weren't checked after an earlier match. Read all three states. If you look only at the awarded score, you'll miss whether the value barely cleared a cutoff or was caught by a fallback rule.
Suppose a quality criterion awards its top band when operating cash flow is positive and exceeds net income. Ask which rule awarded the score and which values made the rule true. That wording keeps the investigation tied to the thesis you actually ran.
Composite systems deserve extra care because a final score can hide offsetting evidence. A profitability rule can add a point while a dilution rule withholds one, yet two companies can land on the same total through different paths. The Piotroski F-score walkthrough shows why the components matter more than the headline sum.
If the matched rule doesn't express your intended claim, fix the thesis. Moving the gate to exclude an awkward company only teaches the rules to recognize a result you've already seen. Rewriting a criterion so its rule states the intended claim gives you something worth testing again.
Follow the feature down to its inputs
Once the rule makes sense, inspect the feature that fed it. From a visible feature value, use Explain this number. Boolean values use Explain this result. Score pills and the gate on the company page open the same explanation layer. The product documentation covers the scan and explanation controls.
Some features are direct reads. Others are calculations assembled from several periods or fields. A trailing sum, growth rate, or ratio won't appear as a finished number in a filing. Its explanation should expand the referenced features and then show the fundamental reads used underneath them.
For each read, check the field, period end, fiscal period, filed date, and source. Those details answer different questions. The period end says what interval the statement describes. The filed date says when that information became available. The source identifies where the row came from. When Quantery has the filing identity, the EDGAR link lets you inspect the primary document.
Don't skip the dates. A correct quarterly value can still be wrong for the research question if it wasn't public on the date being studied. This distinction is why point-in-time data matters in a backtest: the engine must exclude information added to a database later.
Derived features need one more check. Confirm that the numerator and denominator refer to compatible periods and that the denominator means what the thesis claims. If a feature depends on another calculated feature, keep expanding until the chain reaches stored inputs. The release note on how every number can show its work gives a broader tour of that provenance layer.
A missing deep link marks a limit. Older local rows may lack a stored filing accession. In that case Quantery can point to the company's filing index or report that the specific link is unavailable. Leave the filing identity unresolved until the record supports it.
Keep recorded and live values separate
The explanation uses Recorded (run) for the value saved with the selected scan. Live (today) is a current re-evaluation using the run's thesis version and the data now present in the local lake. They answer different questions.
The recorded value tells you what the saved result contained. The live value tells you what the same logic produces against current local inputs. A new filing, a backfilled field, or a changed market-dependent input can make them diverge. Drift is useful evidence because it tells you that the saved observation and the current calculation no longer agree.
The expanded inputs and filing links in the drawer belong to the live re-evaluation. They aren't a recovered calculation trace for an old run. Historical results retain their recorded feature values, but they don't necessarily retain every old input and filing reference used to produce those values. Even when recorded and live agree, today's provenance doesn't become historical provenance after the fact.
That boundary matters when you explain a change. You can say that a recorded feature differed between two saved runs if both values are present. You can't claim that today's linked filing caused the older value. Use run comparison to locate the movement, then consult independently dated records if the cause matters.
Treat missing coverage as part of the result
An explanation can be arithmetically correct and still expose weak coverage. Open Data coverage on the company page when an input is stale, absent, or unexpectedly short. Use Data and filings to inspect the stored periods behind the displayed fundamentals.
Pay attention to null handling. If a required field is missing, did the feature become null, default to a value, or cause the company to drop out? Each policy encodes a research choice. A default can make incomplete data look like evidence. A strict null policy can remove companies from the eligible set. Neither effect should stay hidden.
Data-quality flags deserve the same treatment as scores. Don't dismiss a stale-filing or missing-fundamentals flag because the company passed. Record the limitation and decide whether the thesis can evaluate that company on the evidence available. If it can't, leave the result unresolved or write an exclusion rule.
Turn the audit into the next test
Finish the audit with a short record of what you found:
- The run and thesis version you inspected
- The gate outcome and criterion path
- The feature whose inputs you traced
- Any recorded-versus-live drift
- Any unresolved provenance or coverage issue
- The rule or data check that should change next
Then make the smallest defensible change. Reorder overlapping rules if the wrong one matched. Replace a feature if its inputs don't measure the intended claim. Tighten the null policy if missing data is being rewarded. If new data caused the issue, rerun the unchanged thesis first.
If the result survives that inspection, run a backtest. Trust still depends on the test. Use the exact rule you audited, preserve the version, and write down the failure condition before seeing the output. A thesis worth testing is one you can revise without losing track of the claim.
An audit connects the result to its dated source data. Change the part that failed, save the new version, and run the research again.
Research tooling, not investment advice. Nothing here is a recommendation to buy, sell, or hold any security. Screens, scores, and backtests are informational only; backtested results are hypothetical, exclude costs such as commissions and slippage, and do not guarantee future results. Verify against primary filings and make your own decisions.
Want to try this on your own rules? Quantery is free for 14 days: the full app, no card required.
← All articles