How to read a backtest report
Read a backtest report from the bottom up: check coverage first, then the event count, then the event study, and only then the portfolio curve. The return is the most tempting number on the page. It is also the easiest one to misunderstand without the assumptions underneath it.
A Quantery report answers two related questions. The event study asks what happened after a company newly passed your gate. The portfolio asks what a simple rules-based account would have done while holding those companies. Keep those questions separate. Agreement between them is useful evidence. A disagreement is useful too, because it tells you where to investigate.
Check whether the test had enough data
Start with the coverage note and any warning attached to the report. Coverage means the historical observations the engine could actually use at each rebalance date: eligible companies, point-in-time filings, prices, and universe membership. The requested date range isn't proof that all of those inputs existed throughout it.
Quantery aligns fundamentals to their filing dates, so a statement becomes visible to the simulated researcher only after it was public. Point-in-time SEC fundamentals support backtests from 2013, while price depth depends on the user's market-data plan. This is why the walk-forward discipline behind a sound backtest starts with dated inputs. If part of a requested range lacks usable fundamentals or prices, the report says so. An empty or thin early period isn't neutral. It changes which companies could have entered the test.
Read the universe line as part of coverage. A backtest on a named index should say how membership was resolved through time. A custom list answers a different question from an exchange-wide universe. Reconstructed membership before recorded snapshots is an approximation, and the coverage note carries that limit forward. How to choose the universe your screen runs on explains why the universe belongs inside the thesis.
Then check the count of go events. A go event is the first date a company qualifies after failing to qualify at the prior rebalance. It is an entry signal for the event study. The final survivor list is a separate snapshot. One company can produce another go event after dropping out and later qualifying again.
A small event count makes every average fragile. One spectacular outcome can pull the mean upward. A busy result has the opposite problem: repeated events may share the same market regime and therefore aren't fully independent observations. Counts don't certify a result. They tell you how much weight the summary can bear.
Read the event study before the portfolio
The event-study table reports outcomes over several forward horizons. For each horizon, start with n, the number of events that had enough later price history to be measured. Recent go events can contribute to a short horizon while remaining unavailable at a longer one, so the sample normally shrinks as the horizon grows.
Next read hit rate, the share of measured events that beat the chosen benchmark over that horizon. A hit rate above half means winners were more common than losers relative to that benchmark. It doesn't tell you how large either group was.
That is why the table also shows mean and median excess return. Excess return is the event's total return minus the benchmark's total return over the same interval. The mean is the arithmetic average across events. The median is the middle observation after sorting them.
Compare the pair:
- Mean well above median suggests a few large winners may be carrying the average.
- Median above mean suggests some severe laggards are pulling the average down.
- Both on the same side of zero suggests the direction was broad enough to survive two summaries.
- Opposite signs say the typical event and the average event tell different stories.
Don't collapse the horizons into one verdict. A positive short-horizon result followed by a negative long-horizon result may describe a brief re-rating that faded. The reverse may describe a signal that needed time. It may also reflect a much smaller long-horizon sample. Read the horizon, n, hit rate, mean, and median as one sentence.
The event study deliberately removes portfolio mechanics. It asks whether new qualifications tended to outperform from their signal dates. It doesn't decide how many positions an account could hold, how overlapping signals interact, or when a held company should be sold. That narrower question is valuable when you want to know whether the gate itself carries information.
Read the portfolio as a policy test
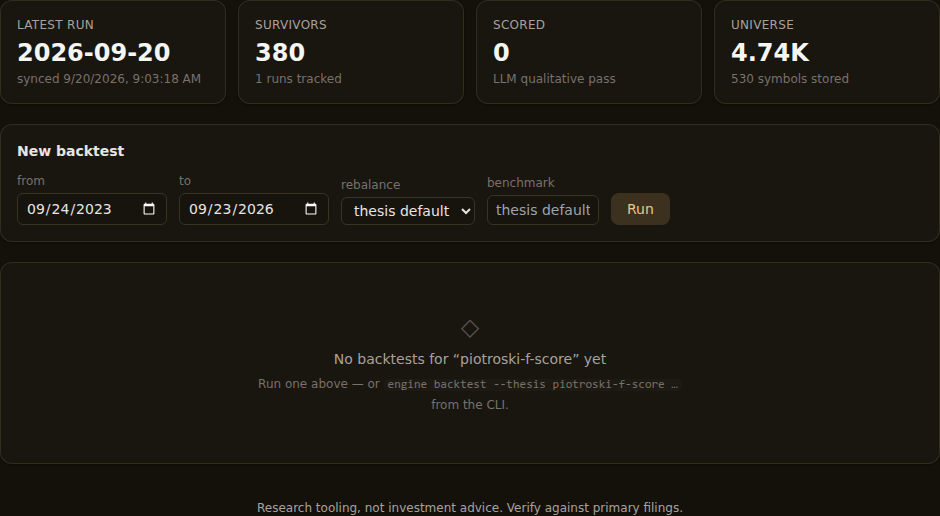
The portfolio curve adds decisions the event study leaves out. The thesis's backtest settings control the rebalance cadence, maximum holding period, exit on gate failure, reporting lag, and benchmark. The engine applies those rules walk-forward, using only information available at each simulated date.
The headline portfolio return is the compounded result of that policy. It differs from the average event return. Signals can overlap. Positions can remain open across several rebalances. Exit rules can cut an event short or keep it after the horizon table has taken its measurement. A strong event study can therefore coexist with a weak portfolio, and vice versa.
Compare the curve with the benchmark over the same dates. A rising strategy line proves little if the opportunity set rose further. The benchmark should resemble the kind of market the thesis searches. A broad large-company benchmark can be poor context for a screen concentrated in small companies. How to choose the right backtest benchmark gives that choice a full treatment.
Now read maximum drawdown, the largest peak-to-trough decline in the simulated portfolio. It answers a different question from total return. Two runs can finish in the same place while taking very different routes. The deeper route is harder to follow, and the backtest assumes the rules stayed in force through it.
Quantery's portfolio is deliberately naive. It is a consistent research model and doesn't reconstruct anyone's brokerage account. Backtested figures are hypothetical and exclude trading frictions and taxes. That matters most for thinly traded names and high-turnover rules. Use the curve to compare versions of a thesis. Don't treat it as an account forecast.
Investigate when the two views disagree
Suppose the event study looks respectable but the portfolio lags. First inspect timing. A signal may work over one forward window but the exit policy may hold much longer. Weekly rebalancing may admit transient qualifiers that a monthly schedule skips. A large cluster of simultaneous go events can spread the portfolio across many similar exposures.
Next inspect the distribution. A positive mean beside a weak median says the event result may depend on rare winners. A portfolio with position limits or overlapping holdings won't necessarily capture those winners at the same weight as the event study. Open the go-event timeline and ask whether the largest cluster came from one industry or one market episode.
Then inspect churn. Exit on gate failure can turn a feature that flickers near its cutoff into repeated entries and exits. The event study records each fresh qualification, while the portfolio pays the practical price of the rule's instability. Changing a hard cutoff into a scoring band may be the better research question. Testing whether a screen is just a sector bet is the next check when events arrive in a concentrated block.
The reverse disagreement also needs work. A portfolio can beat while the median event lags if a few long-held positions dominate the compounded path. Check the mean, the timeline, and the curve for dependence on those outcomes. Don't award the gate credit before showing that the result survives without one narrow cohort.
Turn one report into the next test
One report should produce a short list of controlled reruns. Keep the thesis version fixed and change one assumption at a time:
- Change the rebalance cadence and see whether the conclusion survives a different observation clock.
- Add reporting lag and test whether the result depends on acting too close to the filing date.
- Change the exit rule or maximum hold to see whether the gate or the holding policy drives the outcome.
- Replace the benchmark with one that better matches the opportunity set.
- Split the date range into subperiods and look for dependence on one regime.
Write down what failure looks like before each rerun. If monthly results disappear under a weekly cadence, that doesn't automatically disprove the thesis, but it does make timing part of the claim. If changing the benchmark reverses excess returns, market exposure was doing more of the work than the original story allowed.
Keep the recorded reports. Quantery stores the thesis version and run settings with each result, so you can compare what you actually tested instead of reconstructing it from memory. How often a backtest should rebalance and how much reporting lag to use show how to perturb those two assumptions without turning the exercise into result shopping.
A good report doesn't end with "the return was high." It ends with a more precise claim: the gate produced this distribution of events, the holding policy turned them into this path, the benchmark provided this context, and the coverage could support this much confidence. Every one of those pieces is yours to inspect, change, and run again.
Research tooling, not investment advice. Nothing here is a recommendation to buy, sell, or hold any security. Screens, scores, and backtests are informational only; backtested results are hypothetical, exclude costs such as commissions and slippage, and do not guarantee future results. Verify against primary filings and make your own decisions.
Want to try this on your own rules? Quantery is free for 14 days: the full app, no card required.
← All articles