How to set stock screen thresholds
Set a stock-screen threshold by starting with the business claim and the precision of the input before you inspect any scan or backtest output. Choose a round value you can defend in words and add an acceptable band when evidence changes gradually. Give null values a separate rule. Then rerun nearby values and compare which companies cross the boundary before you read returns.
You won't discover one uniquely correct cutoff in a result table. The useful threshold is the one that makes your claim explicit and remains informative when a nearby, equally plausible value replaces it. That standard keeps the parameter attached to the business idea instead of the most flattering run.
A threshold is an economic claim
A threshold converts a sentence about a business into a rule the thesis engine can evaluate. The sentence comes first.
Suppose the claim is that operating earnings should represent a meaningful yield on enterprise value. Before writing a number, define what meaningful means in this thesis. Is the lower bar meant to reject businesses whose operating earnings are too small relative to their whole-business price? Is the upper bar meant to identify unusually strong valuation support? Those are two different jobs, even when both use the same ratio.
Write the rule in plain language with its unit and denominator:
- An acceptable EBITDA-to-enterprise-value yield begins at the lower proposed cutoff.
- A strong yield begins at the higher proposed cutoff.
- A nonpositive operating-earnings base can't satisfy the claim.
These cutoffs are chosen hypotheses. Their purpose is to make the claim testable. Someone reading the thesis can challenge the definition, change it, and see what follows.
The denominator deserves as much attention as the cutoff. A free-cash-flow yield on market capitalization and an operating-earnings yield on enterprise value don't express the same relationship, even when their reported percentages match. If the ratio mixes an equity-level numerator with a firm-level denominator, tuning the final percentage won't repair the mismatch. Build the metric first, then set its boundary.
Round values expose what you believe
Use the coarsest threshold that still expresses the decision. A round cutoff says the thesis distinguishes a broad valuation band. A cutoff carried to several decimal places claims more precision, so it needs an economic reason for every extra digit. In most thesis work, that reason doesn't exist.
Round values also make later changes legible. Moving an acceptable yield by a modest, predeclared step is an understandable challenge to the original claim. Nudging only the last decimal place looks like a search over digits, especially after returns are visible.
The input's precision matters too. Trailing fundamentals combine values reported across several periods. Enterprise value moves with market price, while filing values arrive on discrete dates. A sharp cutoff can therefore make two economically similar observations land on opposite sides. More decimal places in the parameter don't give the underlying measurement more certainty.
Named parameters keep those choices visible. The bundled Earnings Yield + Quality template, for example, separates acceptable and strong cutoffs for earnings yield and return on capital. You can inspect the values without digging through each rule.
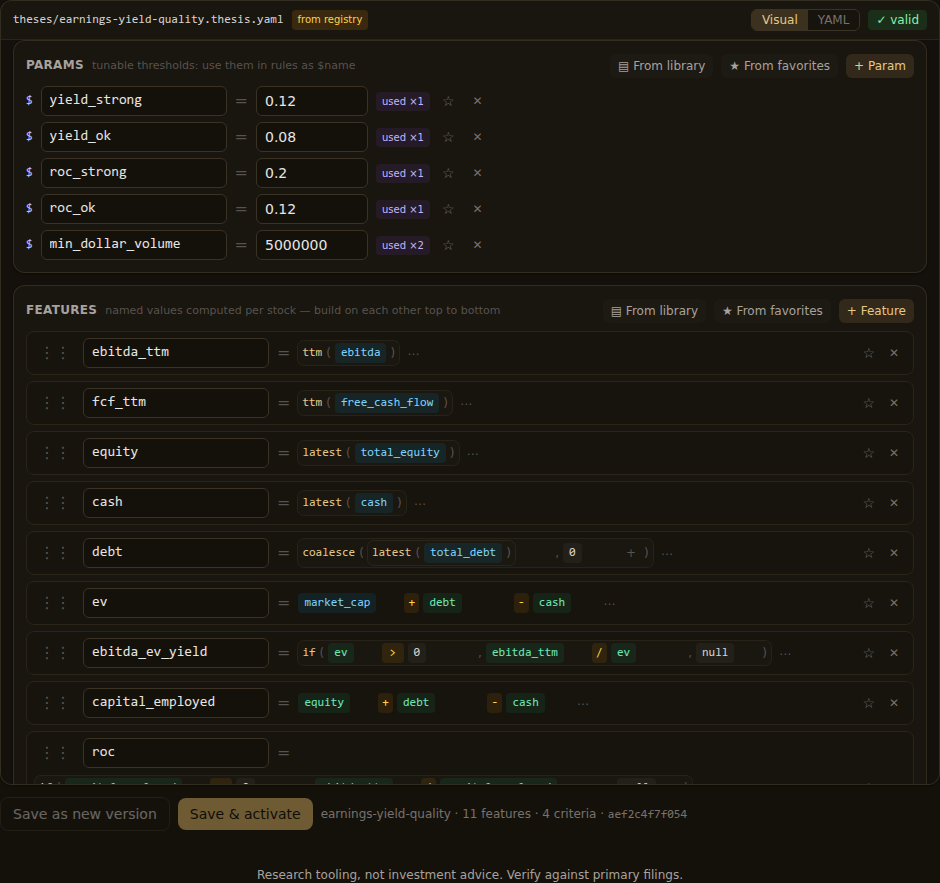
The round-parameter discipline used to build a testable thesis continues after the first value is chosen. Each parameter needs a stated job and consistent units. A nearby rerun then shows what moves across its boundary.
Score bands soften a false cliff
A single pass-fail cutoff says the evidence changes all at once. Many accounting and valuation signals don't behave that way. Businesses sitting just below and just above the strong cutoff may support almost the same interpretation.
Score bands let the thesis represent that uncertainty. An acceptable band can earn a lower score and a strong band a higher score. The order matters because Quantery criterion rules are evaluated from the first match downward. The strong condition must appear before the acceptable one, or every value above the lower bar will match too early.
The shape below is illustrative, and the bundled templates are the reference for exact fields. The Quantery thesis documentation covers the full DSL.
params:
  yield_strong: 0.12
  yield_ok: 0.08
  roc_strong: 0.20
  roc_ok: 0.12

criteria:
  earnings_yield:
    rules:
      - { when: "is_null(ebitda_ev_yield) or ebitda_ttm <= 0", score: 0, flag: no_operating_earnings }
      - { when: "ebitda_ev_yield >= $yield_strong", score: 2 }
      - { when: "ebitda_ev_yield >= $yield_ok", score: 1 }
      - { else: 0 }
  returns_on_capital:
    rules:
      - { when: "is_null(roc)", score: 0, flag: no_capital_base }
      - { when: "roc >= $roc_strong", score: 2 }
      - { when: "roc >= $roc_ok", score: 1 }
      - { else: 0 }

gate:
  mode: strict
Each score-band boundary stays visible, with less meaning assigned to either jump. The lower boundary says when evidence begins to support the criterion. The upper boundary says when that support becomes strong. You should be able to finish both sentences before running the thesis.
The final gate remains a separate decision. In the example, strict mode means every criterion must earn a positive score. Score mode would let strengths offset weaknesses. Strict gates and score gates encode different claims, so don't change the gate while judging whether the bands are well placed.
Missing values need their own rule
A null value means the input needed for the comparison is absent. Treating it as a weak result can produce accidental credit or hide why a company failed.
Put the null guard first and give it a named flag, as the example does for roc and operating earnings. If the whole thesis can't be evaluated without that field, add it to quality.required so points elsewhere can't compensate for missing evidence. If absence has a legitimate business meaning, encode that meaning explicitly instead of relying on default behavior.
This separation also improves threshold testing. When a company disappears after a parameter change, you want to know that it crossed the numerical boundary. A dropout caused by an absent filing value answers a data-coverage question. Mixing the two makes membership changes harder to interpret.
Compare membership before returns
Every cutoff creates a set of companies on each side. That membership is the first output to inspect because it reveals what the parameter does directly. Returns add market timing and weighting, plus the backtest window, before you've established whether the boundary selects the intended businesses.
Start with the survivors and near misses. For each changed name, record the feature value and the band it left or entered. Check any quality flag separately. Then ask whether the movement makes sense under the sentence that defined the threshold. A company crossing from acceptable to strong should look like a stronger instance of the same claim. A cluster of changes in one industry may reveal that the ratio has a sector-specific scale.
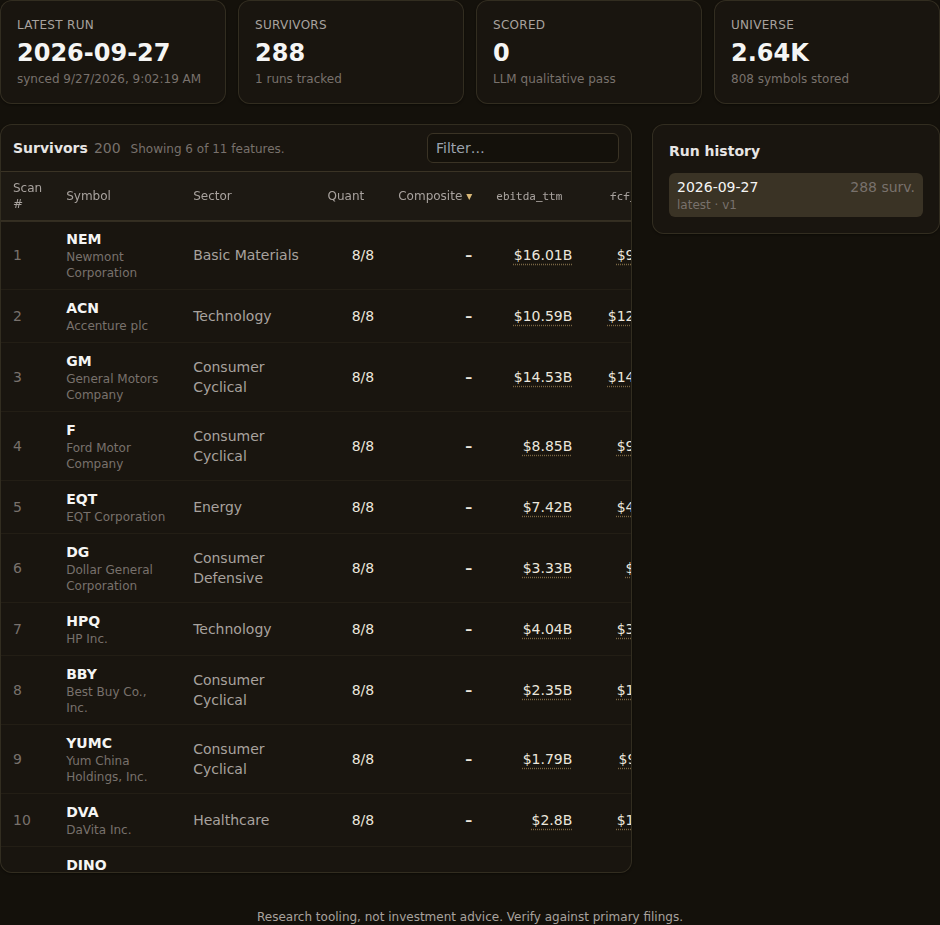
Keep the universe fixed during this comparison. A threshold change and a universe change can produce the same added-and-dropped pattern for different reasons. The universe is part of the thesis definition, so preserve it along with the data date and every unrelated parameter.
Membership churn is informative even when the total survivor count barely moves. Equal numbers of additions and removals leave the count unchanged while replacing part of the set. Compare identities and criterion scores as well as totals.
Nearby reruns test the boundary
Choose the sensitivity checks before launching them. Move each proposed cutoff a modest step lower and higher while preserving the same units. Use nearby values that remain plausible under the original business sentence.
Change one parameter per run. Record which names changed bands and whether they entered or left the gate. Check those movements for sector concentration. Stop after the predeclared checks. An exhaustive grid invites you to keep the decimal that produces the result you wanted.
A stable threshold can produce gradual, understandable membership changes as the boundary moves. If a small nudge replaces much of the set, the thesis may be sitting on a dense part of the distribution. That can mean the parameter carries more selection power than your original story assigned to it.
Read hypothetical backtest returns only after the membership comparison. The aim is stability across plausible settings. Keep the dates, benchmark, reporting lag, and rebalance cadence fixed, and remember that backtests exclude trading costs. A one-dial-at-a-time robustness check can then show whether the conclusion survives the nearby thresholds you chose in advance.
Use ranks when the claim is relative
An absolute threshold fits a sentence with an absolute meaning: the yield must exceed a stated rate, leverage must remain below a stated multiple, or cash flow must be positive. A percentile rank fits a relative sentence: the company should sit near the top of the current universe on this feature.
Switching to a rank changes the claim behind an uncertain threshold. A top-decile rule will always depend on who else is in the universe, while an absolute bar can admit many companies or none. The guide to percentile ranks and absolute thresholds covers that choice in depth. Make it before sensitivity testing so the reruns challenge one kind of claim.
Keep the decision with the thesis
A defensible threshold leaves a short paper trail:
- The business sentence says what crossing the boundary means.
- The ratio definition preserves the right numerator and denominator.
- The parameter is round enough for the input's precision.
- Nulls have an explicit rule or a required-data guard.
- Nearby checks were chosen before output was inspected.
- Membership changes were read before hypothetical returns.
The cutoff remains a judgment, and that record makes it inspectable. Another researcher can move the cutoff by a predeclared step, rerun the same thesis, and see exactly which conclusions survive. That's the useful standard for a parameter. The rules stay visible and the boundary can be challenged. The result can be retested.
Research tooling, not investment advice. Nothing here is a recommendation to buy, sell, or hold any security. Screens, scores, and backtests are informational only; backtested results are hypothetical, exclude costs such as commissions and slippage, and do not guarantee future results. Verify against primary filings and make your own decisions.
Want to try this on your own rules? Quantery is free for 14 days: the full app, no card required.
← All articles