How to tell if a backtest result is real
You ran a backtest and the line beat the benchmark. The question that matters next has nothing to do with how big the number is: would the conclusion survive a change it shouldn't care about? A backtest result is real to the extent that it keeps its direction when you move the start date, and keeps it again when you change the rebalance cadence. A real result also survives a nudge to a threshold that was never central to your story. If the conclusion flips under moves like those, the settings were doing the work all along.
That's the whole method. The rest of this post is how to run it in practice, with a live example: three backtests of the same screen, on the same install, that return three different verdicts. None of the three is lying, and reading them together tells you more than any one of them could.
Same rules, three verdicts
Earlier this month we ran the bundled Earnings Yield + Quality template through Quantery's backtester three times on our own install, and this week we read the persisted reports back over the app's MCP server, exactly as the app records them. Same thesis version, same benchmark (SPY, an ETF tracking the S&P 500), three configurations:
- January 2013 through early August 2026, monthly rebalance: the run's portfolio returned +361%. SPY returned +550% over the same run. The screen trailed by almost 190 points.
- January 2023 through early August 2026, monthly rebalance: +168% against +99% for SPY. Ahead by about 70 points.
- January 2023 through early August 2026, weekly rebalance: +133% against +108%. Ahead by about 25.
All three runs are hypothetical, exclude trading costs, and test only the thesis's quantitative gate. Same rules in every one. So which is "the" result?
None of them. The spread is the finding. If you had run only the first, you'd have shelved the screen; only the second, and you'd be pricing the yacht. A single-run workflow doesn't just risk a wrong answer, it hides the fact that the answer moves.
Why one good run proves so little
There's a name for the statistics underneath this. Run enough configurations and one will look good by chance, and the more you try, the better the best one looks. Bailey, Borwein, López de Prado, and Zhu showed that high simulated performance is easily achievable after trying a relatively small number of strategy configurations, and gave the practice its name: backtest overfitting. Their sharpest observation is about disclosure. Almost nobody reports how many configurations they tried, so the reader of a backtest can't tell a discovery from the tail of a search.
The professional literature has the same disease at scale. Harvey, Liu, and Zhu catalogued hundreds of published factors claiming to explain stock returns and concluded that the usual significance test (a t-statistic above 2.0) is far too lenient once you account for how much has been tried; a newly discovered factor, they argue, should clear 3.0. The scale is different at your desk, but the machinery is identical. Twelve variants over a weekend is a search, and the run you remember is the best of the search.
Running fewer backtests fixes nothing. What changes the game is what you look for when you run many: stop hunting for the configuration with the prettiest curve, and start checking whether a conclusion survives across configurations.
Change one dial and re-run
Perturbation only teaches you something if you can attribute the change, so move one setting at a time. The second and third runs above differ in exactly one: monthly rebalancing versus weekly. That one dial cut the margin over the benchmark from about 70 points to about 25, a drop of nearly two-thirds. Both runs finished ahead; the size of "ahead" collapsed. (The two reports don't even agree on what SPY returned over the window, +99% in one and +108% in the other, which tells you the runs aren't measuring over identical dates. Compare each run against its own benchmark line only.)
Read as a robustness check, that's a useful verdict: over this window, the screen's direction survived the cadence change and its magnitude did not. So the direction is the part you're allowed to keep thinking about, while any specific number should be treated as an artifact of settings. A backtest's headline return is the least portable thing in its report.
Thresholds get the same treatment, and this is where the loop gets short: every threshold in a Quantery thesis is a named parameter, so a perturbation is one edit and one re-run.
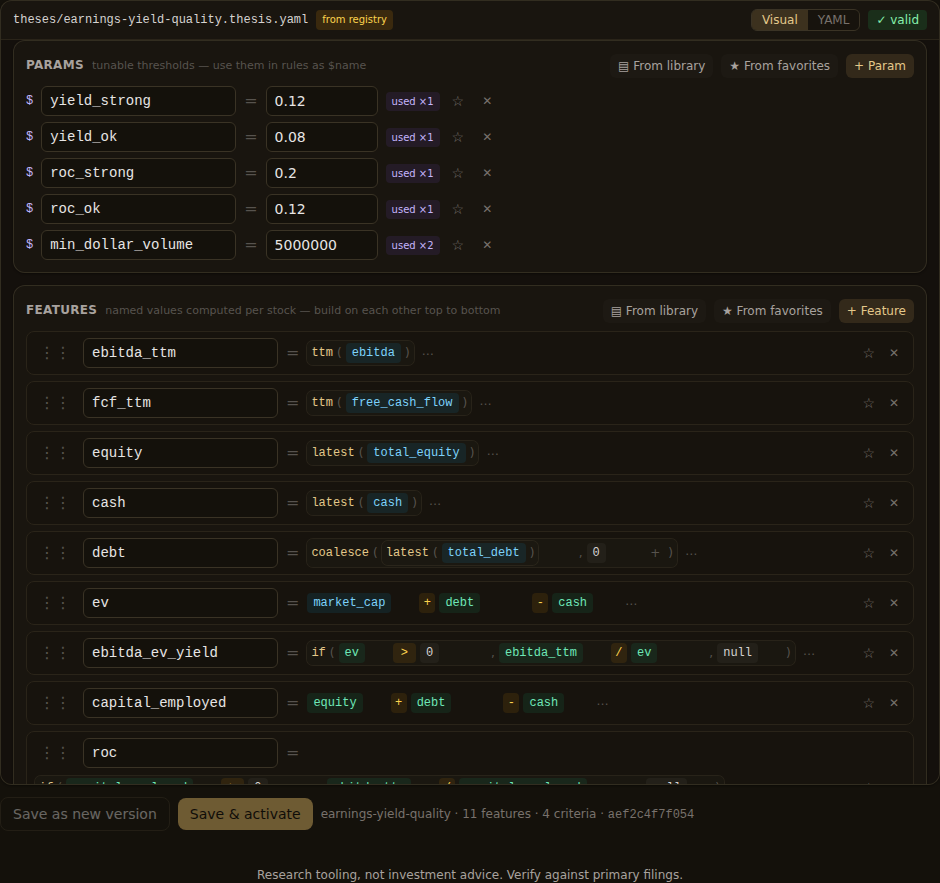
If yield_strong at 0.12 makes the idea look great and 0.11 makes it look like nothing, what you've found is the dial. The round-number discipline exists for exactly this reason: a threshold you can't move without killing the result was never a belief about businesses.
Move the window before you trust the period
The first and second runs differ only in their start date, and the verdict flips outright: trailing by 190 points becomes leading by 70. Start a value screen's test in January 2023 and you're grading it on one kind of market. Start in 2013 and you include years where the same rules went nowhere against an index that returned +550% across the run. Neither window is the true one. A rule that only works in one regime isn't disqualified (a regime can be the thesis), but you want to discover that property on purpose, in the report, rather than by surprise in a drawdown. The full-period run also carried a 38% maximum drawdown against 16% for the 2023 monthly run: the same rules, lived through, feel like different products.
One more habit for reading a single report: don't stop at the portfolio line. Quantery pairs the portfolio with an event study, which follows each qualification event (a stock newly passing the gate) forward and measures it against the benchmark from there. In the winning monthly run, the average event beat SPY by 1.9% over the month after qualifying, across 533 events with at least a month of subsequent history. At the twelve-month horizon there are only 37 events with a full year of after-history, their average excess return is negative 6.2%, and just 15 of the 37 finished ahead. The equity curve says the screen finished ahead; the one-year event view says the average qualifying stock that's old enough to judge lost ground. That's a small sample, and the two views weight time differently, but when they disagree, the disagreement is the most informative line in the report. (What a backtest can and can't tell you covers the data defects that corrupt reports; this is the reading skill for reports that aren't corrupted.)
Check what the run actually saw
Before believing any of the three, read the coverage numbers, which sit in the same report as the returns. The full-period run evaluated an average of 148 names per rebalance. The 2023 monthly run evaluated 512. Same universe definition in both; what changed is how much of the market the data can describe at each simulated date. Point-in-time fundamentals reach back to 2013, price depth depends on your market data plan, and universe membership for dates before your install began recording daily snapshots is reconstructed. The report says this about itself: the reconstructed portion is approximate and "skews optimistic." So the thirteen-year verdict is really a verdict about the recent years plus a thinner, flattering sketch of the early ones, and the report's own coverage note tells you so.
That's the trio's third lesson: a backtest is an answer about the data it saw, and the universe your screen runs on is as much a setting as any threshold. Two runs that disagree may not disagree about the strategy at all. They may disagree about who was in the room.
What a robust result looks like
After all the re-running, what are you allowed to conclude? A robust result keeps its direction under every perturbation you tried. Its coverage numbers describe a universe you recognize. And it was specified before the search: write down what failure looks like before the first run, then hold yourself to it, including the part where you stop tweaking.
Notice what's absent from that list: a minimum return. Robustness is about the stability of a conclusion under changes of settings. How big the number is matters less than whether the number is still there after the shaking, and a modest edge that survives everything you do to it deserves more attention than a spectacular one that only exists on Tuesdays.
The practical obstacle used to be cost: at a per-run fee, nobody perturbs anything. Quantery's backtests are unlimited, runs queue behind data jobs instead of failing, and every report persists with its exact settings, so the three-run comparison above took no more effort than one run and a memory. Which is the workflow this whole post argues for: many runs, one dial at a time. The prettiest curve is not the result. What survives the shaking is.
Research tooling, not investment advice. Nothing here is a recommendation to buy, sell, or hold any security. Screens, scores, and backtests are informational only; backtested results are hypothetical, exclude costs such as commissions and slippage, and do not guarantee future results. Verify against primary filings and make your own decisions.
Want to try this on your own rules? Quantery is free for 14 days: the full app, no card required.
← All articles