Net current asset value: pricing the business at zero
Most of the numbers investors argue about are attempts to price a future: earnings power, growth, the durability of a moat. Net current asset value — NCAV — is the opposite. It prices a company on the assumption that its future is worth nothing. Take the current assets from the balance sheet — cash, receivables, inventory — subtract everything the company owes, and stop. No credit for the factories, the patents, the brand, or next year's earnings. A stock trading below that number is a net-net: the market is asking less than a pessimist's estimate of the leftovers.
Benjamin Graham built a whole discipline on this number, and it remains the strictest definition of "cheap" in the value canon. It is also nearly extinct as a species — stocks below NCAV are so rare in a normal market that the count of them is information in itself. Both halves are worth understanding properly, so this post does the arithmetic, then the record, then runs the actual screen: today, across 5,299 US names, on point-in-time filings.
What net current asset value actually measures
The inputs sit on the balance sheet of every 10-Q and 10-K, one section apart. Current assets are the assets a company expects to turn into cash within a year: cash and equivalents, short-term investments, accounts receivable (money billed to customers but not yet collected), and inventory. Total liabilities are everything the company owes anyone — not just the bills due this year, but long-term debt, lease obligations, all of it.
net current asset value = current assets − total liabilitiesDivide by shares outstanding and you have NCAV per share, directly comparable to the stock price. Stricter formulations subtract preferred stock as well, since common shareholders stand last in line — the arithmetic of pessimism, as codified by the AAII's summary of the approach, assumes everyone senior to you gets paid in full.
Why call this a floor? Run the thought experiment the number implies: the company shuts down tomorrow; receivables are collected at face value, inventory sells for what the books say, every liability is paid in full — and the fixed assets are given away for free. If the market capitalization is below NCAV, a buyer of the whole company today would receive more than their purchase price back in that wind-down. You paid less than the exit.
Graham didn't even stop there. From the 1949 edition of The Intelligent Investor:
If a common stock can be bought at no more than two-thirds of the working-capital alone — disregarding all other assets — and if the earnings record and prospects are reasonably satisfactory, there is strong reason to believe that the investor is getting substantially more than his money's worth.
Two-thirds of the floor, not the floor itself. The wind-down estimate is already pessimistic; the two-thirds rule demands a discount on top of the pessimism, because the one assumption the formula does make — that current assets are worth their book value — is exactly the one that fails in practice. More on that below.
Did buying below liquidation value actually work?
The strategy has one of the longest paper trails in investing. After the 1929 crash, Graham and Dodd found the market strewn with stocks selling below their current asset value — businesses priced below the cash and inventory in the building. Graham harvested them for decades and reported roughly 20% average annual returns over a 30-year stretch on diversified net-net portfolios.
The academic follow-up held up surprisingly well. Henry Oppenheimer's 1986 study in the Financial Analysts Journal, "Ben Graham's Net Current Asset Values: A Performance Update", tested the rule over 1970–83 and found NCAV portfolios beat market benchmarks on both mean and risk-adjusted returns — with the deepest discounts outperforming by the widest margins. The AAII's account of that work puts the one-year-holding-period portfolios at a 29.4% average annual return. Nor was it an American quirk: a London Stock Exchange study covering 1980–2005 found 31.1% mean annualized returns against 20.5% for the market.
Now the honest reading of those numbers. Every study in that list bought tiny, illiquid, often miserable companies — the kind with wide bid-ask spreads, thin volume, and real delisting risk — and none of the figures include trading costs, which for stocks like these are not a rounding error. (The full checklist for reading anyone's backtest applies with extra force here.) Graham's own risk control was brute diversification: he advocated holding 30 to 100 of these positions at once, precisely because any individual net-net can go to zero without warning. The record says the basket worked; it has never said any single name was safe.
Why did the basket work? Because below the floor, you don't need the business to succeed. Mean reversion, an acquisition, a liquidation, a buyback, or merely "less terrible than priced" — every one of those exits pays you. The bet isn't on the company; it's on the arithmetic, and on time. Which is exactly why the failures cluster where the arithmetic quietly stops being true.
The three ways a net-net keeps falling
The classic objection to net-nets — "there's always a reason" — is correct: the price is low because the business is bad. But the formula already assumes the business is worthless. The problem is when the floor is bad, and it fails in three ways.
The floor melts. NCAV is a snapshot, and a money-losing company eats its own current assets: every quarter of negative free cash flow comes straight out of the number you valued the company on. A 40% discount to a floor shrinking by a third each year is not a margin of safety; it's a race. This is the dominant failure mode today, because in a modern market the companies that trade below NCAV are disproportionately microcaps in sustained cash burn.
The floor gets handed to someone else. A burning company that can't borrow will finance itself by issuing shares. Total NCAV may even hold steady while NCAV per share — the number you actually bought — dilutes away toward whoever funds the next offering.
The floor was never real. Book value is the one optimistic input in the formula. Receivables from customers who won't pay, inventory nobody wants at any price close to cost, cash held inside a subsidiary you'll never reach — all of it counts at face value in the arithmetic and at much less in an actual wind-down. Graham's "reasonably satisfactory" clause was doing quiet work in that quote: he never meant the number to be read without looking at what the current assets were made of.
One purely mechanical trap: the subtraction only means something if both terms come from the same balance sheet. A screen that grabs "the most recent available" current assets and, separately, "the most recent available" total liabilities can end up netting one quarter's assets against another quarter's debts — fabricating a floor no filing ever reported. Quantery's implementation reads both from the same filing and treats a missing field as missing, rather than reaching back a quarter to fill it; if you build your own pipeline, do the same.
Expressing the floor as a screen
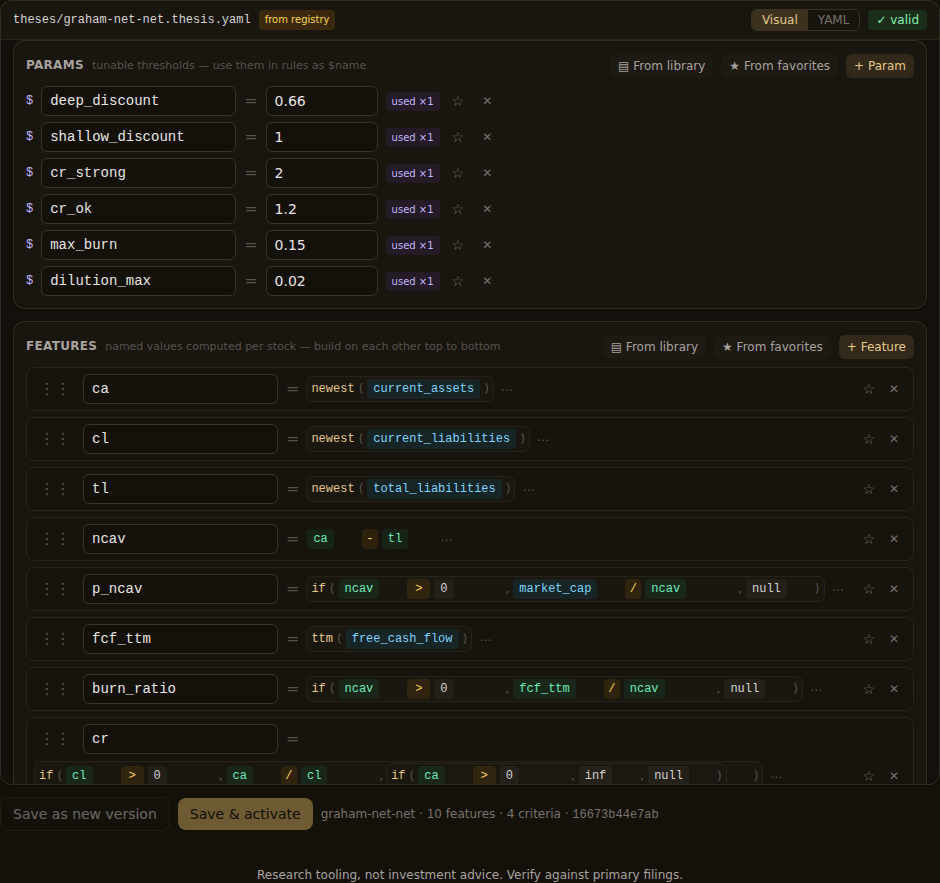
Each failure mode above converts directly into a rule, which is what makes this metric such a clean screening exercise. The shape below is illustrative — the bundled Graham Net-Net template is the reference for exact fields — but the logic is the whole argument of this post in code:
# "Graham's floor, with guards" — illustrative
params:
  deep_discount: 0.66       # Graham's two-thirds rule
  max_burn:      0.15       # tolerable NCAV melt per year
  dilution_max:  0.02       # share-count creep we'll forgive

features:
  ca:           newest(current_assets)
  tl:           newest(total_liabilities)    # same filing as ca — always
  ncav:         ca - tl
  p_ncav:       if(ncav > 0, market_cap / ncav, null)
  fcf_ttm:      ttm(free_cash_flow)
  burn:         if(ncav > 0, fcf_ttm / ncav, null)
  shares_now:   newest(shares_diluted)
  shares_prior: lag(shares_diluted, 4)

criteria:
  discount:                 # the thesis itself
    - { when: "p_ncav <= $deep_discount", score: 2 }
    - { when: "p_ncav <= 1.0",            score: 1 }
    - { else: 0 }
  burn:                     # is the floor melting?
    - { when: "fcf_ttm >= 0",          score: 2 }
    - { when: "burn >= 0 - $max_burn", score: 1 }
    - { else: 0 }
  dilution:                 # is the floor being handed away?
    - { when: "shares_now <= shares_prior * (1 + $dilution_max)", score: 2 }
    - { else: 0 }

gate:
  mode: strict              # every criterion must clear its low bar
Note the gate. In most screens you'd gate the dealbreakers and score the rest; a net-net screen is the rare case where strictness everywhere is the point, because each criterion guards a distinct way of losing. The bundled template adds one more — a solvency check on the current ratio, since a net-net that can't pay its near-term bills liquidates at fire-sale prices rather than book — and excludes financials and REITs, whose balance sheets make "current assets" a meaningless lens.
What the screen found on August 10, 2026
Running the Graham Net-Net template in Quantery today evaluated 5,299 US names from the app's universe snapshot (the template applies a $25 million market-cap floor and the sector exclusions above) against point-in-time fundamentals. Eight survived. And only three of the eight were priced below Graham's true two-thirds line — the other five merely traded somewhere below NCAV itself, the shallower band. Yesterday's recorded run found eleven. A run on July 8 found zero. As always: hypothetical research on point-in-time data, not a recommendation of anything, and the exact count on your machine depends on your own install's data coverage.
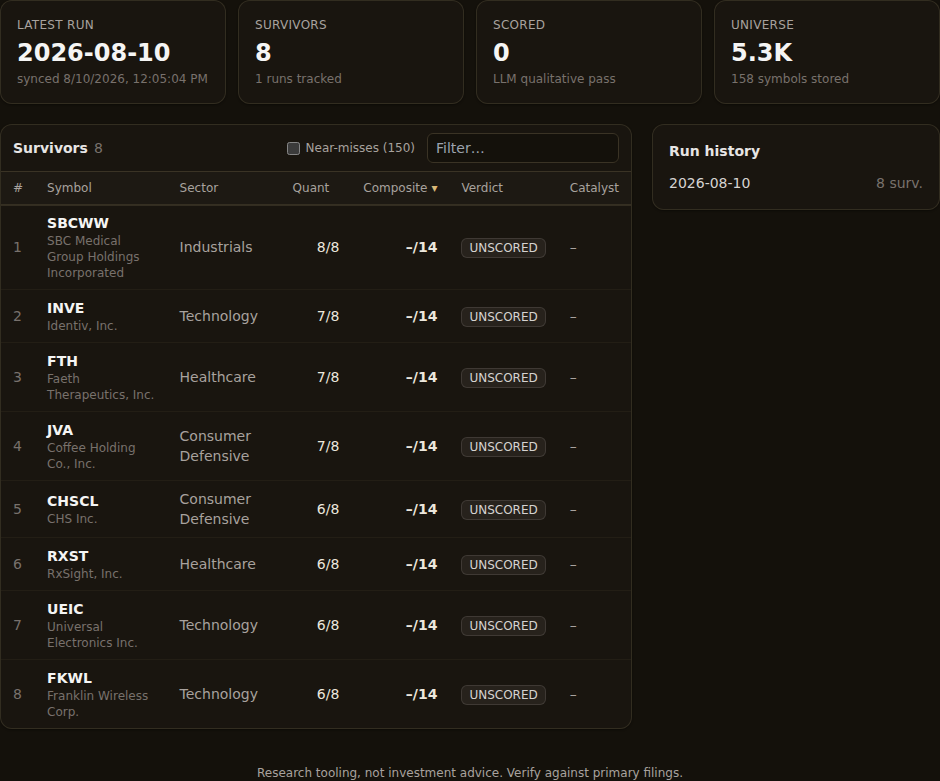
Two observations from the run worth more than the list itself. First, a screen that returns eight microcaps is not a portfolio — Graham's own practice was dozens of names, and at this end of the market every survivor needs per-name verification before you believe its balance sheet — thin listings and odd security types ride along, and the survivor detail view exists so you can check each number against the filing it came from. Second, the near-miss list is instructive: sitting just below the gate are household-name large caps that ace every guard — positive cash flow, fortress solvency, no dilution — and fail only the discount. The discount is the entire game; almost nobody is priced for liquidation in a market like this one.
That last point is why NCAV stays worth watching even when — especially when — the screen comes back nearly empty. After 1929, the market was full of net-nets; today it produces eight. The count is a crude, honest gauge of how much pessimism is on sale, and it costs nothing to track: scans are unlimited, so you can re-run the template monthly and watch the number the way you'd watch any other series. If it ever starts climbing toward Graham's world, you'll want your own version of the guards already tuned and tested.
NCAV tells you nothing about quality, growth, or management — by design; it zeroes all of that out. What it gives you is the market's hardest floor, computed from two lines of a filing you can check yourself on EDGAR, and a screen whose emptiness is as informative as its survivors.
Research tooling, not investment advice. Nothing here is a recommendation to buy, sell, or hold any security. Screens, scores, and backtests are informational only; backtested results are hypothetical, exclude costs such as commissions and slippage, and do not guarantee future results. Verify against primary filings and make your own decisions.
Want to try this on your own rules? Quantery is free for 14 days: the full app, no card required.
← All articles