Return on capital: the quality number screens rank
Return on capital asks how much operating profit a business produces from the capital tied up in its operations. Divide EBIT by capital employed, and you get a way to compare a company that needs a dollar of plant and working capital for every dollar of sales with one that needs very little. EBIT means earnings before interest and taxes. Capital employed means the operating assets that have to be funded.
A high return can point to a business that grows without swallowing much cash. It can't tell you whether the return will last, and the calculation isn't standardized. Change what counts as profit or capital and the answer changes. So a useful screen has to show its formula, reject broken denominators, and let you test a few definitions.
This article builds on working capital and the current ratio, how to read a balance sheet, and what EBITDA leaves out. Those pieces supply the parts. Now we'll assemble them.
What does return on capital measure?
The basic shape is short:
return on capital = operating profit / capital employedThe numerator measures what the operations earned during a period. The denominator measures the capital supporting those operations on a date. Pairing the two asks an economic question that a margin can't answer: how hard did the capital base have to work to produce that profit?
Suppose two businesses earn the same operating margin. One gets paid before it pays suppliers and owns little equipment. The other carries inventory, extends credit to customers, and maintains a large factory base. Their margins match, but the second business has much more money trapped in the engine. Return on capital exposes that difference.
This is also why return on equity isn't a substitute. Equity is the owners' accounting claim after liabilities. Add debt while leaving operations unchanged and equity can shrink, pushing ROE up. Return on capital keeps its attention on the operating asset base. It still has judgment in it, but leverage doesn't get to masquerade as better operations.
Where do EBIT and capital employed come from?
For a filing-based version, use EBIT as the numerator. EBIT is usually the income statement subtotal called operating income or income from operations. It sits above interest and tax, so companies with different financing choices can be compared on the same operating line.
Some screens divide EBITDA by the same capital base. Because EBITDA adds depreciation and amortization back, that version will usually report a higher return and flatter businesses whose assets wear out. Test it separately if it fits your question, but don't treat the two ratios as interchangeable.
Capital employed has several accepted definitions. A Greenblatt-style version starts here:
capital employed = net working capital + net fixed assets
net working capital = current assets - current liabilities
A consistently populated net-fixed-assets field can be hard to carry through a long filing history. Quantery's Greenblatt Magic Formula template uses this available-data approximation:
capital employed = total assets - current liabilities - goodwill - intangiblesYou can read that as net working capital plus noncurrent assets after goodwill and intangibles are removed. It is broader than strict net property, plant, and equipment because other noncurrent assets can remain in the residual. That's one reason to call the calculation an approximation.
Every input comes from the balance sheet. Total assets covers the resources on the books. Current liabilities are subtracted because supplier credit and other short-term operating claims help fund those resources. Goodwill and other acquired intangibles are removed to focus on tangible operating capital.
That last subtraction needs care. Goodwill records part of what a buyer paid in a past acquisition. Removing it keeps a high purchase price from making today's operating business look less efficient. It also means the ratio no longer measures the return on every dollar management actually spent. If acquisition discipline is your question, run a second version that leaves goodwill in.
The denominator is a snapshot while EBIT is a flow. A more refined analysis often averages opening and closing capital. A simple point-in-time screen uses the latest filed balance sheet because that reading is easy to reproduce across the universe. Don't mistake convenience for precision. A seasonal retailer can look very different before and after its holiday inventory clears.
Why See's Candies is the useful historical example
Berkshire Hathaway's 2007 shareholder letter gives a clean example because it reports both earnings and the capital needed to produce them. Berkshire bought See's Candies in 1972, when the company had $30 million of sales, pre-tax profits of less than $5 million, and $8 million of capital required to run the business. In 2007, See's produced $383 million of sales and $82 million of pretax profit while using $40 million of operating capital.
Over that span, Berkshire added only $32 million to the operating capital base. The same letter says See's delivered $1.35 billion of cumulative pretax earnings. Most of that cash could leave See's and be deployed elsewhere because the candy business didn't need it back.
That's what high return on capital can buy an owner: growth in earning power without a matching claim on each new dollar earned. The example isn't a promise that brand businesses always work this way. The letter says See's sold for cash, which eliminated accounts receivable; its production and distribution cycle was short, which minimized inventory; and it regularly raised prices enough to offset inflation. A screen sees the result in the accounts. It doesn't see why customers keep paying more for the box.
The example also shows why goodwill is excluded in an operating-efficiency ratio. Berkshire's purchase price belongs to the acquisition decision. The capital needed to make and sell candy belongs to the operating business. Those are separate questions, and forcing both into one denominator muddies each answer.
What can make a high return misleading?
A small denominator creates a large ratio, even when the small denominator is bad news. Several cases deserve an automatic pause.
Underinvestment. Old equipment is depreciated down on the balance sheet. If management postpones replacement, net fixed assets fall and return on capital rises just before the cash bill arrives. Compare capital spending with depreciation and read the asset age where the filing discloses it. The free cash flow guide shows where that spending lands in cash generation, while the AI capital cycle example shows what happens when the current cash burden surges.
Negative working capital. Customers may pay quickly while suppliers wait, allowing operations to run with little owner-supplied capital. That's powerful when sales are steady. It can unwind when inventory stops moving or suppliers tighten terms. The ratio records the funding advantage but can't judge its durability.
Cyclical peaks. Commodity producers can post rich EBIT against a capital base built years earlier when selling prices spike. The arithmetic is correct for that period. A peak-year numerator isn't normalized earning power.
Acquisition exclusions. Stripping goodwill can reveal the performance of tangible assets, yet a serial acquirer may look excellent after the capital paid for acquisitions disappears from the denominator. Keep a goodwill-included companion ratio if management's allocation record is part of the thesis.
Bad or missing capital. A denominator at or below zero doesn't mean infinite quality. It means this version of the ratio isn't interpretable. Return null, flag the reason, and move on. A screen should refuse impressive nonsense.
How does Quantery calculate return on capital?
The Greenblatt Magic Formula template ranks companies on two measures: earnings yield and return on capital. Its capital feature reconstructs total assets from liabilities plus equity, then subtracts current liabilities, goodwill, and intangibles. This follows the same balance-sheet identity covered earlier while keeping the calculation visible.
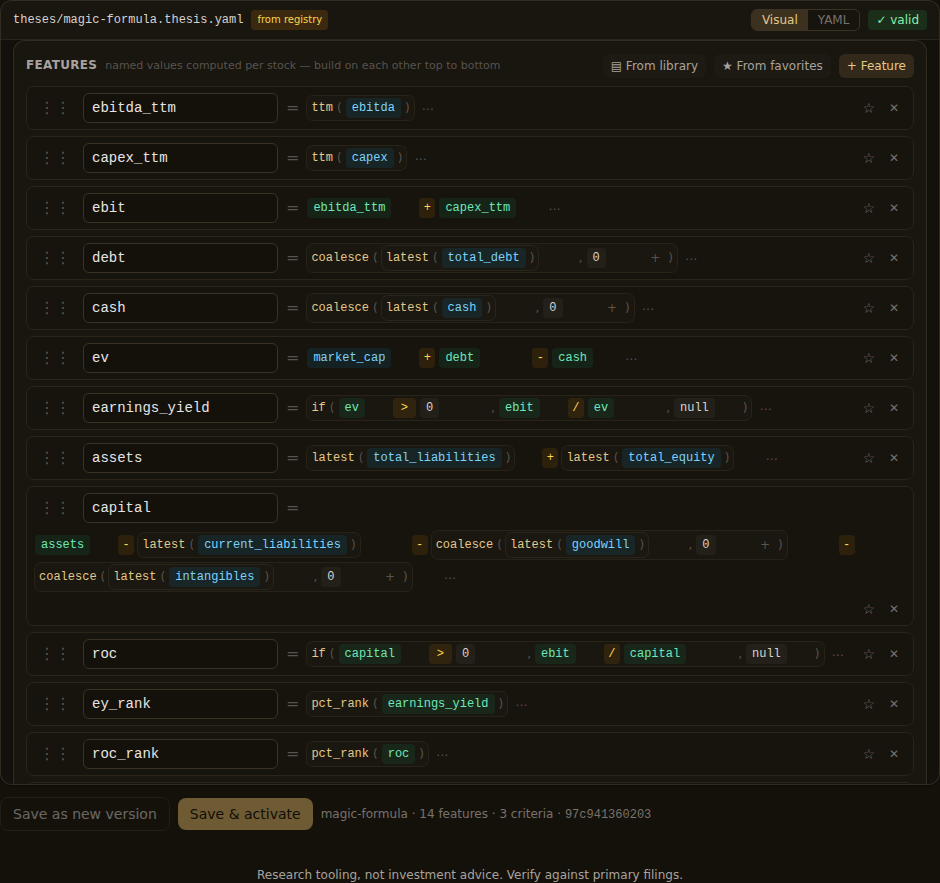
The template documents an important adaptation. It estimates EBIT from trailing EBITDA and capital spending because historical direct operating-income coverage can be uneven in an older local data lake. Capital spending is stored as a negative cash outflow, so adding it to EBITDA subtracts a maintenance-capital proxy. That's stricter than pretending EBITDA is EBIT, but it isn't the filed depreciation charge. Open the template and you can replace the proxy when your coverage supports the direct field.
The Magic Formula doesn't impose one absolute return hurdle. It applies pct_rank() to return on capital, ranks earnings yield separately, and combines the two ranks. A company has to compare well with the rest of the chosen universe. That makes the result depend on the universe, which is exactly what a relative rank should do.
If you want an absolute quality rule instead, the shape below is illustrative. The bundled templates are the reference for exact fields; Quantery's documentation explains how theses, scans, and backtests fit together.
# "Operating profit on tangible capital" - illustrative
params:
  roc_strong: 0.20
  roc_ok:     0.10

features:
  ebit_ttm: ttm(operating_income)
  assets: newest(total_liabilities) + newest(total_equity)
  cl: newest(current_liabilities)
  goodwill_now: coalesce(newest(goodwill), 0)
  intangibles_now: coalesce(newest(intangibles), 0)
  capital: assets - cl - goodwill_now - intangibles_now
  roc: if(capital > 0, ebit_ttm / capital, null)

criteria:
  return_on_capital:
    rules:
      - { when: "is_null(roc)", score: 0, flag: no_roc }
      - { when: "roc >= $roc_strong", score: 2 }
      - { when: "roc >= $roc_ok", score: 1 }
      - { else: 0 }

gate:
  mode: strict
The thresholds are proposed parameters rather than facts about where quality begins. Move them. More usefully, duplicate the thesis and change the definition. Leave goodwill in. Average capital across filing dates. Replace EBIT with free cash flow, accepting that you're asking a different question. Exclude sectors whose balance sheets don't fit the formula. Then backtest each version with point-in-time filings. Any hypothetical results exclude costs. They can show whether a rule held up historically, but they can't explain why it worked or whether it will persist.
A quality rank is a question worth opening
Return on capital earns its place in a screen because it connects operating profit to the resources required to produce it. It distinguishes an engine that releases cash from one that consumes another dollar to make the next dollar of profit.
But the ratio comes with choices. EBIT or cash profit. Tangible capital or total acquisition cost. Closing balance or average balance. Absolute hurdle or market rank. There isn't one vendor field to trust here. Put each choice in the thesis, inspect the companies that clear it, and test whether the result survives a different definition. The rules are yours, which means the denominator is too.
Research tooling, not investment advice. Nothing here is a recommendation to buy, sell, or hold any security. Screens, scores, and backtests are informational only; backtested results are hypothetical, exclude costs such as commissions and slippage, and do not guarantee future results. Verify against primary filings and make your own decisions.
Want to try this on your own rules? Quantery is free for 14 days: the full app, no card required.
← All articles