Trailing vs forward numbers: what a thesis can trust
A screen should score numbers that have been filed. A trailing figure is arithmetic over documents a company has already signed and sent to the SEC. You can look it up and recompute it, and it arrives with a date on it. A forward figure (next year's consensus EPS, the average price target) is somebody's estimate of a number that does not exist yet. Both are worth reading. Only one of them belongs inside the arithmetic that decides whether a stock passes.
That is the whole rule, and the rest of this post is why it holds up. What "trailing twelve months" actually means and how it is assembled. Why multiplying the newest quarter by four produces nonsense on a seasonal business. Why a year-over-year comparison has to match the same fiscal quarter. When a trailing number gets too old to score. And where forward estimates do earn a place on the row.
This is the second article in a series that builds up the vocabulary our screens use. The first one laid out how the three financial statements fit together; every number below is a line item off one of them.
What trailing twelve months actually means
Trailing twelve months (TTM) is the sum of a company's four most recent quarterly filings. It is not the fiscal year, and it is not the calendar year. It is a window that rolls forward every time a new 10-Q lands, dropping the oldest quarter and picking up the newest.
Here is one, built from real filed quarters. Reading Amazon's point-in-time fundamentals out of our own data lake today, 25 August 2026, the four most recent quarters of revenue are $180.2 billion (quarter ending September 2025), $213.4 billion (December 2025), $181.5 billion (March 2026) and $200.6 billion (June 2026). Add them and TTM revenue is $775.7 billion. No vendor computed that for you. It is four numbers off four filings, summed.
In the thesis DSL that sum is ttm(revenue), and there is a matching sum(field, n) when you want a different window. One behavior worth knowing before you trust the output: ttm() sums whatever subset of the four quarters is present and returns null only when all four are missing. A company that has filed three of its last four quarters still produces a TTM number, and that number is understated. It looks like every other TTM number on the page. Knowing that is most of the defence: pair a trailing read with the staleness and history checks below, and treat a name with a patchy filing record as one you have not really measured.
Why annualizing the newest quarter goes wrong
The tempting shortcut is to take the latest quarter and multiply by four. Run it on the same filings.
Amazon's December 2025 quarter, annualized, gives $853.5 billion, about 10 percent above the trailing figure. The March 2026 quarter, annualized, gives $726.1 billion, about 6 percent below it. Same company, same twelve months of business, and a spread of roughly $127 billion depending on which quarter you happened to pick up.
Nothing changed at the company. December is the holiday quarter, and consumer businesses concentrate their year into it. March is the hangover. Any screen that annualizes a single quarter is scoring the calendar and reporting it as a business.
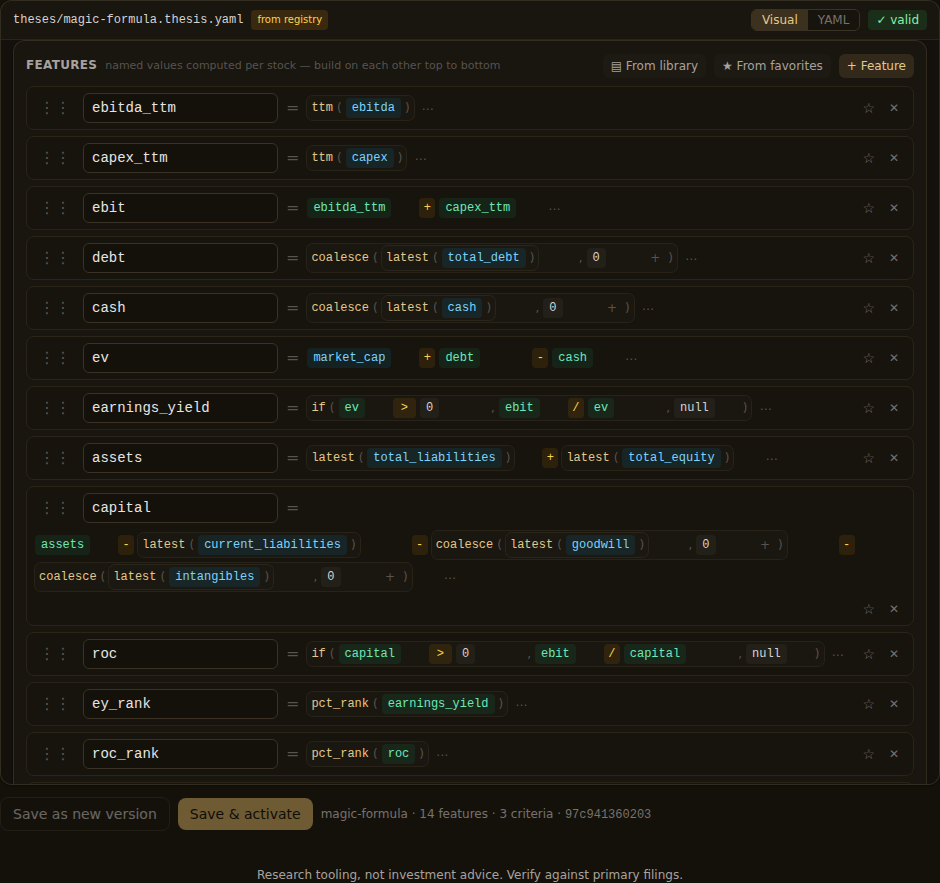
TTM fixes this by construction: a four-quarter window contains exactly one of each fiscal quarter, so seasonality cancels out. That is why flows (revenue, cash flow, capex, net income) get read through ttm(), while balance-sheet levels get read as the snapshots they are. The bundled Greenblatt Magic Formula shows both habits in one screen.
Compare a quarter to the same quarter
Seasonality does the same damage to growth rates, and it is easier to fall for because the number looks so reasonable.
Take Amazon's March 2026 quarter against the December 2025 quarter that came right before it: $181.5 billion against $213.4 billion, a 14.9 percent decline. Read as a business event, that is a company falling apart. Now compare the March 2026 quarter to the March 2025 quarter, $155.7 billion: revenue up 16.6 percent. The first comparison measures Christmas. The second measures the company.
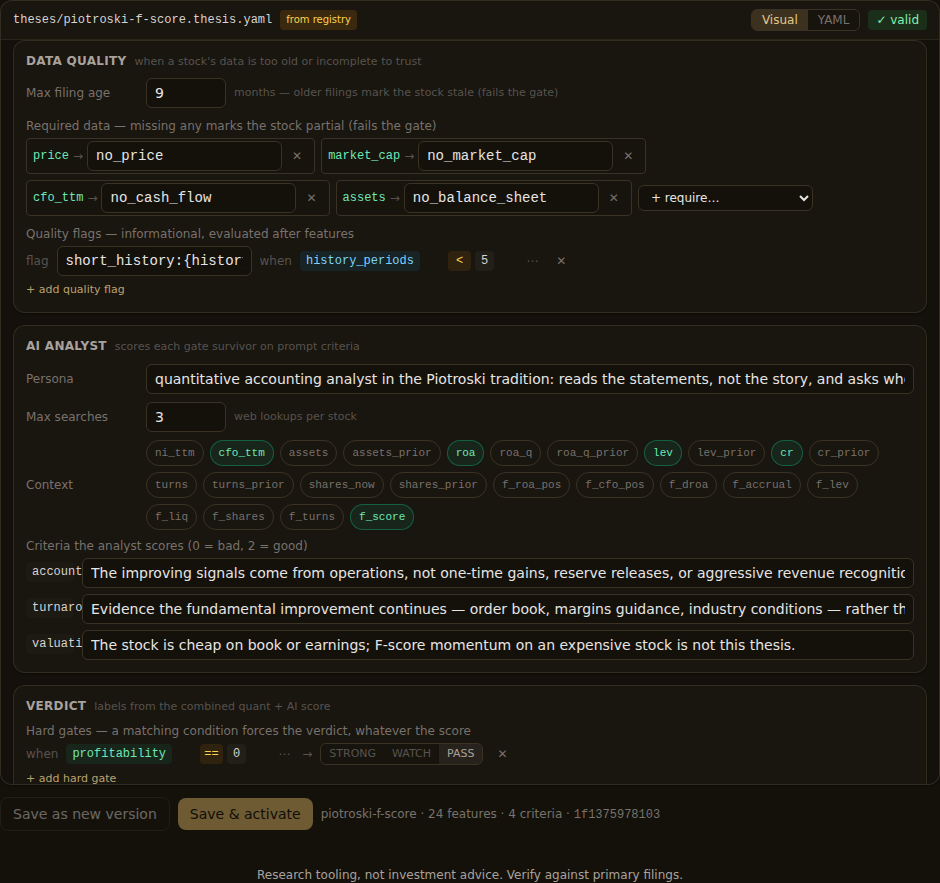
So year-over-year comparisons match the same fiscal quarter a year earlier. In the DSL that is lag(field, 4), four periods back. The Piotroski F-Score template uses it for every one of its change signals: lag(net_income, 4), lag(total_debt, 4), lag(shares_diluted, 4).
lag() is positional, and that detail matters. It counts filings backwards, not months, so if a company has a gap in its filing series then "four back" stops meaning "a year ago". The template handles it two ways at once. A quality flag fires short_history on any name with fewer than five periods on record, and the scoring policy treats a null comparison as a signal not earned. Missing data loses points rather than winning them.
A trailing number has a shelf life
Filed does not mean current. Every thesis carries a staleness bound: stale_months sets how old the newest filing may be before the stock is marked stale, and a stale name fails the gate no matter how well it scored. All five bundled templates set it to nine months, which lets a company miss a quarter and still be screened, but not go dark for a year.
The other half of freshness is the gap between when a period ends and when its filing appears. Amazon's June 2026 quarter ended on 30 June and was filed on 31 July. For those 31 days, the most recent thing any reader could have used was the March quarter. A screen run on 15 July that scored June numbers would be reading a document that did not exist yet.
This is why our fundamentals are indexed by filing date rather than period date, and why backtests carry a reporting_lag_days setting that keeps a filing invisible to the simulation until a day after it lands. Getting this wrong is the most common way a homemade backtest flatters itself, which the article on backtest honesty covers in full.
What a forward number is
Forward numbers are projections, and US securities law says so in as many words. The statutory safe harbor defines a forward-looking statement to include "a projection of revenues, income, earnings per share, capital expenditures, dividends, capital structure, or other financial items", and protects it from liability when it is identified as forward-looking and accompanied by meaningful cautionary statements. The law is built around the expectation that these numbers will turn out wrong.
Analyst estimates carry error that someone has gone and measured. A Federal Reserve staff paper by Steven Sharpe and Antonio Gil de Rubio Cruz, Predicting Analysts' S&P 500 Earnings Forecast Errors and Stock Market Returns using Macroeconomic Data and Nowcasts (July 2024), finds that a simple macroeconomic model of aggregate S&P 500 earnings, combined with GDP forecasts from the Blue Chip Survey and recent dollar moves, "can predict large and statistically significant errors in equity analysts' bottom-up forecasts for S&P 500 earnings in the current quarter and the quarter ahead". The errors are forecastable from information that was already public when the forecast was made. If a number can be improved by data anyone could have looked up, it is not a measurement of the company.
There is also a plumbing problem specific to backtesting them. Quantery's vocabulary does carry forward variables: est_eps_next_fy, price_target_avg, price_target_count. But consensus data restates in place. The provider overwrites the estimate rather than archiving each day's version, so your local history of it begins the day your install starts recording and runs forward from there. SEC filings do not work that way, which is why point-in-time fundamentals support backtests from 2013 while an estimate has no comparable archive on your machine. Scoring a simulated 2019 on a consensus figure would mean feeding the past a number nobody had.
Writing the rule down
Here is the discipline as a screen. The shape is illustrative and the bundled templates are the reference for exact fields, but the structure is the point:
# "Trailing numbers only, compared like with like" - illustrative
params:
  min_history: 5              # quarters needed before a YoY read means anything
  growth_strong: 0.10

features:
  rev_ttm:     ttm(revenue)              # four filed quarters, seasonality cancelled
  rev_q:       newest(revenue)           # the newest quarter on its own
  rev_q_prior: lag(revenue, 4)           # the same fiscal quarter, a year back
  fcf_ttm:     ttm(free_cash_flow)
  rev_growth:  if(rev_q_prior > 0, rev_q / rev_q_prior - 1, null)
  fcf_margin:  if(rev_ttm > 0, fcf_ttm / rev_ttm, null)

quality:
  stale_months: 9             # older than this and the name cannot pass
  required:
    rev_ttm: no_revenue
  flags:
    - { when: "history_periods < $min_history", flag: "short_history:{history_periods}" }
    - { when: "price_target_count > 0", flag: "covered_by:{price_target_count}" }

criteria:
  growing:
    rules:
      - { when: "is_null(rev_growth)", score: 0, flag: no_yoy }
      - { when: "rev_growth >= $growth_strong", score: 2 }
      - { when: "rev_growth > 0", score: 1 }
      - { else: 0 }
  cash_margin:
    rules:
      - { when: "fcf_margin >= 0.10", score: 2 }
      - { when: "fcf_margin > 0", score: 1 }
      - { else: 0 }

gate:
  mode: strict
Every scored input traces to a filing. rev_growth compares like with like because lag(revenue, 4) reaches back four periods rather than one, and the short_history flag makes it visible when that reach was unreliable. fcf_margin divides one trailing window by another, so neither side is a seasonal artifact; if you want the longer argument for why cash flow is the flow worth trusting, free cash flow is the number hardest to fake.
And price_target_count sits in the flags block on purpose. It rides along on the row so you can see how many analysts cover the name. It never touches a score. That is the working position on forward numbers: read them, put them on the page, keep them out of the arithmetic.
None of this makes a trailing number predictive. TTM revenue tells you what a business did through last quarter and says nothing about next quarter, which is exactly why forecasts exist and why people pay for them. What the trailing discipline buys you is a screen whose every input has a filing date and a document behind it, so when a stock shows up on your survivors list you can go and check the claim. The DSL reference has the full vocabulary if you want to build one of these yourself.
Next in the series: the balance sheet, and what book value does and does not tell you.
Research tooling, not investment advice. Nothing here is a recommendation to buy, sell, or hold any security. Screens, scores, and backtests are informational only; backtested results are hypothetical, exclude costs such as commissions and slippage, and do not guarantee future results. Verify against primary filings and make your own decisions.
Want to try this on your own rules? Quantery is free for 14 days: the full app, no card required.
← All articles