Turning an oil price spike into a testable thesis
This week handed anyone who screens stocks a textbook piece of hard-to-use news. On Monday, while the S&P 500 slipped 0.1 percent, the Energy Select Sector SPDR rose 4.6 percent, with West Texas Intermediate crude rising to $82.32 a barrel and Brent to $87.86 on renewed Middle East supply worries. A day later, the US Energy Information Administration's Short-Term Energy Outlook raised its estimate of shut-in Middle East crude production, said it assumes severe constraints on Strait of Hormuz shipping persist through August, and forecast Brent averaging around $85 a barrel in the third quarter. News like that generates a hunch almost automatically: oil is going to stay high, so I should own energy.
The way to make that hunch useful is not to act on it. It is to take it apart. Inside "I should own energy" live three different claims: a macro claim about where the oil price goes, a cross-sectional claim about which companies benefit if it stays there ("cross-sectional" just means comparing companies against each other at the same moment), and a timing claim about whether showing up right after a spike is better than showing up any other week. Only one of the three is something a fundamentals screen can actually test. Splitting a headline into its testable and untestable parts is the whole craft of turning news into research, and this week's move is a clean worked example.
The detail that complicates the story
Start with the part of the news that most of the coverage skipped. The same EIA outlook that raised its disruption estimates (it now assumes roughly 0.6 million barrels per day of Middle East supply stays shut in, an assumption it carries through 2027) also forecasts that Brent will fall back to an average of $69 a barrel in 2027. Hold both halves in your head at once: the agency documenting the supply squeeze expects the squeeze to fade. The forward path it publishes points down from here, not up.
That matters because Monday's sector move is the market repricing on the squeeze while the squeeze's own chronicler calls it temporary. Add Wednesday's July CPI report, which showed consumer prices rising 0.1 percent for the month and 3.4 percent over the year, and you have the full nervous picture: oil high enough to feed inflation worries today, forecast to normalize next year. Whatever you believe about the Middle East, "energy stocks up on supply fears" is not yet a thesis. It is a mood with a catalyst. To use it, you have to decide which of the three claims you are actually making.
Why "oil will stay high" is not a screenable thesis
The macro claim comes first because it is the one your screen cannot touch. A stock screen selects companies by comparing their filed fundamentals, and it has no opinion about tanker traffic through the Strait of Hormuz, nor any way to acquire one. There is no proxy for geopolitics in a 10-Q (a proxy being a measurable stand-in for an idea; this idea has none). If your genuine belief is "Brent stays above $85", be honest about what that is: a commodity price view. There are markets that express that view directly, and a basket of equities is a noisy, management-encumbered way to approximate it.
What a fundamentals screen can do is condition on the macro view instead of pretending to test it. The form is: if energy exposure, then which names? That is a real question with a testable answer, and it is where the news stops being the story and your rules start. The general discipline is the subject of how to build a thesis worth testing: separate the claim (rules for selecting companies today) from the prediction (what you expect to happen to them afterward), give every concept a measurable proxy, and delete whatever you cannot measure.
The cross-sectional claim: which energy names work at $69 oil?
Here the EIA handed you something better than a headline: a stress test. If Brent averaging $69 is the published base case for 2027, then an energy company that is only attractive at $85 is not a stock thesis. It is the macro bet again, wearing a ticker. The cross-sectional claim worth testing is that energy companies generating real free cash flow on conservative balance sheets (the ones built to survive $69) hold up better through an oil cycle than their sector at large. Free cash flow is operating cash flow minus capital spending: the cash actually left over after the business pays to maintain itself, which for a capital-hungry industry like energy is precisely where the truth lives.
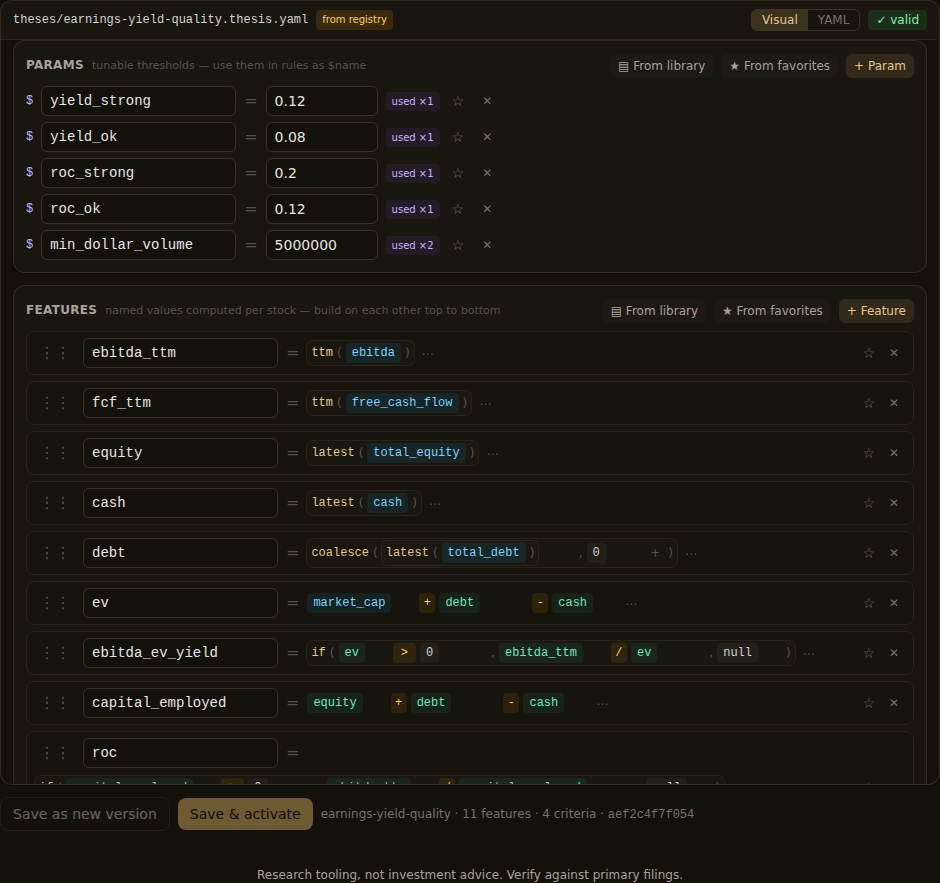
In Quantery you would express that from raw point-in-time fundamentals. The shape below is illustrative (the bundled templates are the reference for exact field names), but this is genuinely how the thesis assembles:
# "Energy that works at the EIA's 2027 price" (illustrative)
params:
  yield_strong:     0.10    # cash-rich even for a cyclical
  yield_ok:         0.06
  leverage_max:     1.0     # net debt / EBITDA, the downcycle test
  conversion_floor: 0.7     # FCF should back reported earnings

universe:
  sector: energy            # the claim is within-sector, so the screen is too

features:
  fcf_ttm:     ttm(free_cash_flow)
  ebitda_ttm:  ttm(ebitda)
  ni_ttm:      ttm(net_income)
  net_debt:    latest(total_debt) - latest(cash)
  fcf_yield:   if(market_cap > 0, fcf_ttm / market_cap, null)
  leverage:    if(ebitda_ttm > 0, net_debt / ebitda_ttm, null)
  conversion:  if(ni_ttm > 0, fcf_ttm / ni_ttm, null)

criteria:
  cash_generation:
    - { when: "fcf_yield >= $yield_strong", score: 2 }
    - { when: "fcf_yield >= $yield_ok",     score: 1 }
    - { else: 0 }
  balance_sheet:
    - { when: "leverage <= $leverage_max", score: 2 }
    - { when: "leverage <= 2.0",           score: 1 }
    - { else: 0 }
  earnings_backed:
    - { when: "conversion >= $conversion_floor", score: 1 }
    - { else: 0 }

gate:
  - fcf_ttm > 0             # cash now, not projected
  - leverage < 3            # survivors of the next downcycle only

verdict_bands:
  strong: score >= 4
  watch:  score >= 2
Now write down the gap, because this screen has a real one. Every input is trailing twelve months ("TTM": the last four reported quarters, summed), and in a commodity sector the trailing window embeds the commodity price. Four quarters of elevated oil make the entire sector's free cash flow look strong at once, so the cash generation criterion is partly measuring the very thing you wanted to be robust against. That is why the balance sheet criterion carries equal weight. Net debt to EBITDA (total debt minus cash, divided by trailing operating profit before depreciation) is the closest thing the filings offer to "can this company refinance and keep operating when the price breaks." Leverage is the honest proxy for surviving $69; trailing cash flow alone is not.
The timing claim: does buying the spike work?
The third claim hides in the word "now". Buying energy this week rather than any other week asserts that a spike day carries information about what follows. You can state that precisely ("after the sector rises more than 4 percent in a day, it outperforms over the following quarter") and it is testable in principle. But be honest about what kind of test it is. It is an event study, meaning you measure what happens on average around a defined trigger, and one-day sector moves that large are rare, clustered in exactly the crisis regimes where averages mislead. A handful of events across a few oil shocks will produce a number. It will not produce confidence.
A timing rule is also where excluded costs bite hardest. Backtests, Quantery's included, are hypothetical and exclude spreads, slippage, and taxes. That omission is survivable for a patient low-turnover screen and brutal for anything that trades on trigger days, when spreads are at their widest. If the cross-sectional screen is the meal, treat the timing claim as seasoning: something you test hoping to confirm it does not matter much, not something you lean on.
What this week's news is actually worth
The honest workflow, then. Write the three claims down. Concede the macro claim to the markets that actually price it. Put the cross-sectional claim through a walk-forward backtest, in which the rules act only on information available at each simulated date before the clock advances. And treat the timing claim as a small-sample event study, read with suspicion. Run the history on point-in-time fundamentals, so each simulated date sees filings as they stood then, not as they were later restated; Quantery's SEC fundamentals support backtests from 2013, which is enough runway to include oil regimes very different from this week's. Scans and backtests are unlimited, so testing the same screen at several parameter settings costs nothing but minutes, and what makes a backtest honest covers how to read the results without fooling yourself. Whatever survives is a fact about the past, before costs, never a promise. But it is a far better possession than a mood.
That split generalizes well past oil, which is the real takeaway. News will keep arriving: a sector will spike, an agency will publish a forecast, a headline will hand you a hunch. The questions are always the same three. What is the macro claim I cannot screen for? What is the cross-sectional claim I can? What is the timing claim I am smuggling in by acting today? The middle one is where screens live, and the rules you write there stay yours: when the EIA revises its outlook next month, you move a parameter and re-run, instead of waiting for someone else to update their story.
Research tooling, not investment advice. Nothing here is a recommendation to buy, sell, or hold any security. Screens, scores, and backtests are informational only; backtested results are hypothetical, exclude costs such as commissions and slippage, and do not guarantee future results. Verify against primary filings and make your own decisions.
Want to try this on your own rules? Quantery is free for 14 days: the full app, no card required.
← All articles