What EBITDA measures, and what it leaves out
EBITDA is earnings before interest, taxes, depreciation and amortization. Take operating profit off the income statement, add back the depreciation charge, and you have it. The point of the exercise is to see what the operating business earns before you account for how it was financed, where it pays tax, and how quickly its accountants are writing down assets bought in earlier years.
What it leaves out is the price of those assets. Depreciation is a non-cash charge in the quarter you read it, but the cash left the building when the equipment was bought, and in a capital-heavy business it leaves again every year to keep the equipment working. EBITDA charges nothing for that. It's a reasonable way to compare two operating businesses carrying different debt loads. It's a poor way to work out what an owner gets to keep.
This is the next stop in a series building the vocabulary our theses run on. It picks up two earlier threads: where operating profit sits on the income statement, and the leverage ratios a thesis reads, where we promised to finish the net debt to EBITDA story here.
Where the number comes from in the filings
EBITDA isn't a line item. No GAAP statement carries it, which is the first thing worth knowing about it. You assemble it from two documents:
EBIT   = operating income (also printed as "income from operations")
EBITDA = EBIT + depreciation and amortization
EBIT (earnings before interest and taxes) is usually sitting right there as a subtotal on the income statement, after cost of revenue and operating expenses have come off the top line. Everything below that subtotal is financing and tax.
Depreciation and amortization is harder to find, because for most filers it's buried inside cost of revenue and operating expenses instead of being broken out. The place it always appears is the cash flow statement, as the first and largest add-back on the walk from net income to operating cash flow. That's the number you pull.
Quantery builds ebitda per filed period the same way: operating income plus the depreciation and amortization tagged in that same filing, falling back to pretax income plus interest plus D&A for filers who publish no operating subtotal at all. One consequence you should know before writing a rule on it. When a filing doesn't tag D&A, the add-back is zero and the stored EBITDA equals operating income. The field will hold EBIT under an EBITDA label, and no error is raised, because nothing went wrong. There was nothing to add back.
Why strip interest and taxes at all
Picture two identical widget factories with the same sales and the same machines. One is funded entirely with equity, the other carries a pile of debt. Their net income will differ by the interest bill and the tax that follows from it, even though the two businesses are doing the same thing equally well. EBIT and EBITDA make them comparable again by cutting the statement above the financing.
That's a real analytical gain, and it's why the same logic produces enterprise value on the other side of the ratio: if the numerator ignores who financed the business, the denominator has to price the whole business rather than the equity slice. Tax gets stripped for a weaker reason, mostly jurisdiction, loss carryforwards, and one-off settlements that say little about operations.
Lenders like the number for a different reason. They're trying to size a rough annual cash flow available to service borrowings before the borrowings are paid, which makes net debt over EBITDA a natural yardstick for them. That framing is fine for a lender who gets paid first. It's worth remembering it wasn't designed for the owner who gets paid last.
What the add-back hides: a cable company's 2024
Cable is the textbook case, because the business is a physical network that has to be built and then kept up forever. Take Charter Communications' full-year 2024 results, a release the company put out itself.
- Total revenues: $55,085 million
- Income from operations (EBIT): $13,118 million
- Depreciation and amortization: $8,673 million
- Adjusted EBITDA, the company's own non-GAAP figure: $22,569 million
- Interest expense, net: $5,229 million
- Capital expenditures: $11,269 million
- Free cash flow, as the company reports it: $4,257 million
Add EBIT and D&A and you get $21,791 million of plain EBITDA, about $778 million below the company's Adjusted EBITDA, because "adjusted" is a definition the filer writes for itself. Charter's release spells its definition out and says the number "eliminates the significant non-cash depreciation and amortization expense that results from the capital-intensive nature of the Company's businesses." The disclosure is doing its job. Read it as an instruction: this figure has had the cost of the network taken out of it.
Now look at what the network actually cost that year. Depreciation charged $8,673 million. Capital expenditure spent $11,269 million of real cash, $2,596 million more than the charge EBITDA added back. So the add-back doesn't just defer the cost of the assets, it understates the current-year outlay by two and a half billion dollars. Take the $22,569 million of Adjusted EBITDA, pay the capex, pay the interest, and $6,071 million is left before tax, working capital, and everything else. The company's own free cash flow line lands at $4,257 million. That's the distance between the headline number and the money.
Warren Buffett's version of this is shorter. In Berkshire's 2000 shareholder letter he wrote that "references to EBITDA make us shudder," and asked whether management thinks "the tooth fairy pays for capital expenditures." A quarter century on, the tooth fairy still hasn't shown up in anyone's cash flow statement.
Finishing the leverage story
The gross debt piece left the coverage ratio unfinished, so here it is with the same company's numbers. Charter closed 2024 with $459 million of cash, $1,799 million of current debt, and $92,134 million of long-term debt: total debt of $93,933 million, net debt of $93,474 million.
Measured the lender's way, that's 4.1 times Adjusted EBITDA. Measured against EBIT, which has paid for the depreciation, it's 7.1 times. Same balance sheet, same year, two ratios that would sit in very different bands of your leverage rule. Neither is wrong. They answer different questions, and a thesis has to pick one and know which it picked.
Our Buffett Quality Value template picks the EBITDA version, because that's the convention its threshold was calibrated against, and it guards the edge case: a company with negative EBITDA produces a negative "net debt to EBITDA" that would otherwise sail through the template's <= 2.0 test looking conservative. The rule flags it and scores it zero.
What the templates do with EBITDA
Three of the five bundled templates lean on it, and they're worth reading as examples of choosing a proxy in the open.
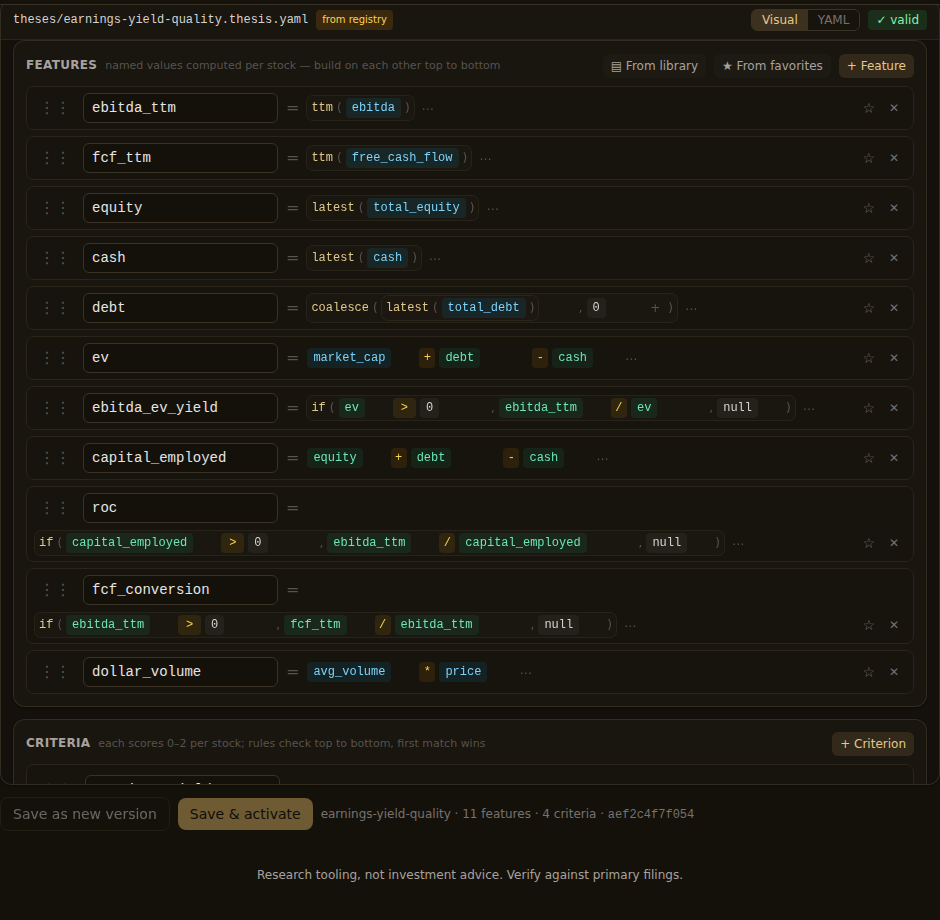
Earnings Yield + Quality computes ebitda_ttm once and spends it three times: as the numerator of an EV yield, as the numerator of return on capital, and as the denominator of a free-cash-flow conversion ratio that asks how much of that EBITDA survives the trip to actual cash. That last feature is the article's warning built into the thesis, and it's the one that separates a cable network from a software company scoring the same yield.
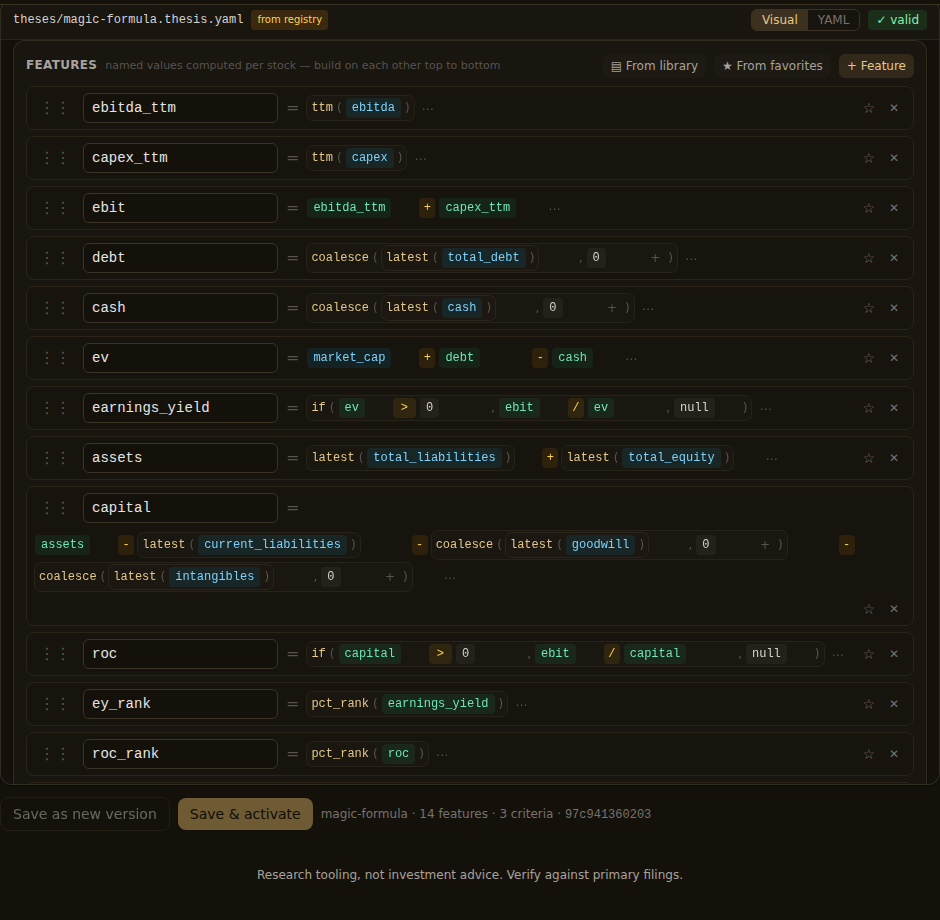
The Magic Formula wants EBIT, so its third feature reads ebitda_ttm + capex_ttm. Capex is stored as a negative number, so that addition is a subtraction: it charges each company its actual capital spending in place of its depreciation charge, which is the old maintenance-capex approximation. On Charter's 2024 figures that swap would have been the stricter reading by $2,596 million. When capex is missing the feature returns null and the name drops out of the scan, so a gap in the data can't dress a company up as pure EBITDA.
You can go further than the template does. operating_income and depreciation_amortization are both point-in-time columns in your own lake now, so nothing stops you writing the direct version and comparing:
# "Cheap on EBITDA, and still cheap after the capital charge" - illustrative
params:
  yield_ok: 0.10           # EV yield that qualifies
  da_gap_max: 1.2          # capex may exceed depreciation by 20%, no more

features:
  ebitda_ttm: ttm(ebitda)
  ebit_ttm:   ttm(operating_income)          # the direct read
  da_ttm:     ttm(depreciation_amortization)
  capex_ttm:  ttm(capex)
  ev:         market_cap + debt - cash
  ebitda_yield: if(ev > 0, ebitda_ttm / ev, null)
  ebit_yield:   if(ev > 0, ebit_ttm / ev, null)
  capital_gap:  if(da_ttm > 0, -capex_ttm / da_ttm, null)

criteria:
  cheap_both_ways:
    - { when: "ebit_yield >= $yield_ok", score: 2 }
    - { when: "ebitda_yield >= $yield_ok", score: 1 }
    - { else: 0 }
  capital_charge_honest:
    - { when: "capital_gap <= $da_gap_max", score: 1 }
    - { else: 0 }

gate:
  - ebit_ttm > 0
The shape is illustrative and the bundled templates are the reference for exact fields, but the idea holds: score the two yields separately and watch the spread. A company where they're close owns light assets or has finished building. A company where the EBITDA yield clears your bar and the EBIT yield doesn't is telling you the depreciation charge is the whole story, and capital_gap says whether this year's cash outlay is even worse than the charge.
One coverage caveat before you run it. The direct income-statement columns were added to the lake after the earliest ingests, so older rows can sit null until a re-pull fills them in, the same trap the income statement piece flagged for gross profit. Check the coverage on your own data before trusting a backtest that depends on those fields going back years, and remember that any backtest is hypothetical and excludes costs.
EBITDA is worth having in your vocabulary because it isolates one real thing: operating performance, before financing. Keep it for that, ask what the assets cost every time you use it, and put a second number next to it in the thesis. The rules are yours to write, and this is one where writing your own is a twenty-minute job with a visible answer at the end.
Research tooling, not investment advice. Nothing here is a recommendation to buy, sell, or hold any security. Screens, scores, and backtests are informational only; backtested results are hypothetical, exclude costs such as commissions and slippage, and do not guarantee future results. Verify against primary filings and make your own decisions.
Want to try this on your own rules? Quantery is free for 14 days: the full app, no card required.
← All articles