When capex outruns cash flow: a screen for the AI buildout
This week Alphabet sold $25 billion of investment-grade bonds in a 10-part offering, with maturities stretching from two to 40 years. Peak demand reached roughly $115 billion, more than four times the deal, and only two order books this year were bigger: Oracle's record $129 billion in February and Amazon's roughly $126 billion in March. Three of the year's largest bond deals, all from technology companies that were, until recently, famous for not needing anyone's money.
You cannot test "is AI a bubble." That question has no measurement attached, and arguing about it produces opinions, not positions you can grade. But hiding inside this week's news is a claim you can test: capital spending at some of the most profitable companies in history is now growing faster than the cash their operations produce, and capex is a line item on the cash flow statement of every US filer. When capex outruns operating cash flow, free cash flow compresses by arithmetic. Whether that compression has historically told you anything about what happens next to the stock is an empirical question. This article turns the news into that question.
What happened this week, in cash flow terms
Start with why Alphabet is borrowing at all. In late July the company reported that quarterly capital expenditure doubled to $44.9 billion, swinging free cash flow to a deficit of $5.9 billion against $10.1 billion generated in the first quarter. It was the company's first ever negative free cash flow quarter. Management also raised full-year 2026 capex guidance to a range of $195 billion to $205 billion, up from $180 billion to $190 billion, the second raise this year. Two weeks later came the bond sale.
Alphabet is the sharpest example, not an outlier. Reuters notes that Big Tech collectively is expected to spend more than $730 billion this year, primarily on AI. FactSet's credit team, looking at the five hyperscalers (Alphabet, Amazon, Meta, Microsoft, Oracle), traces aggregate investing cash outflows from $95 billion in fiscal 2020 to around $490 billion in the most recent twelve months. And the funding mix has shifted: incremental debt covered about 9% of that capex in fiscal 2024; over the twelve months through mid-2026 it covered 32%.
One thing this is not: a distress story. FactSet's same analysis puts total debt to EBITDA around 1x or below for four of the five (Oracle is the exception, and was downgraded by S&P in July). A $115 billion order book is the bond market being enthusiastic, not nervous. The interesting fact is quieter than danger: the largest companies in the market have stopped funding their growth entirely from operations, and that change is legible in exactly the statements your screens read.
Why debt-funded capex changes what your screens see
Free cash flow is operating cash flow minus capital expenditures. That subtraction is the whole reason FCF is the number that's hardest to fake, and it is also why a capex surge crushes FCF mechanically, with no accounting mischief required. Alphabet in Q2 was enormously profitable and free cash flow negative at the same time. Earnings and cash diverged, but unlike the accrual games covered in that earlier post, this divergence is disclosed, deliberate, and sits in the investing section for anyone to read.
Here is the practical consequence. Every FCF-based value screen, including two of the templates that ship with Quantery, is beginning to change its mind about these businesses. A name that scored well on free cash flow yield for a decade drifts toward zero or negative as the buildout accelerates. Your screen will start dropping it. Is that the screen working correctly, or a blind spot? That depends on a question the screen cannot answer: whether today's capex becomes tomorrow's cash flow.
And capex booms are genuinely ambiguous. The market has watched heavy spenders hollow themselves out (telecom fiber in the late 1990s, shale drillers outspending cash flow through the 2010s), and it has watched heavy spending compound magnificently (the first decade of cloud data centers looked reckless to value investors the whole way up). A capex surge is empire-building in one history and the best capital allocation of the decade in another. No screen distinguishes them in advance. What a screen can do is identify the footprint precisely, so a backtest can tell you how that footprint fared across the history you have.
Three measurable proxies for capex outrunning cash flow
Following the discipline from how to build a thesis worth testing: each fuzzy idea gets one number, computable from filings, with the gap between the number and the idea written down honestly.
Capex intensity: trailing capex over trailing operating cash flow. Above 1.0, operations are not funding the buildout; the difference must come from the balance sheet: cash reserves, debt, or new equity. Alphabet's Q2 is what crossing that line looks like from inside one quarter.
Capex acceleration: trailing capex against a year ago. Intensity says how heavy the spending is; acceleration says how fast it is getting heavier. A railroad runs high intensity forever, in a steady state. What made this week's news was the rate of change: a guidance raise on top of a guidance raise.
The funding gap: positive net income with negative free cash flow. Profitable on paper while consuming cash. This is the precise shape of Alphabet's quarter, and it is a condition, not a score: a company either sits in that quadrant or it does not.
Now the gaps, written down. Capex intensity is not AI exposure: utilities and pipelines score high in every era, so a screen for intensity alone surfaces infrastructure, not a theme. Acceleration is closer to the story but catches every young company building its first factory. And one blind spot worth knowing from the FactSet piece: the hyperscalers also carry roughly $820 billion in lease-related commitments that are not recognized as balance sheet liabilities. Capacity rented rather than bought shows up faintly, late, or not at all in a capex line. Your screen sees purchased buildout, not leased buildout.
Expressing it as a screen
The shape below is illustrative, as always: the bundled templates are the reference for exact field names, and the DSL guide in the docs covers the functions. But this is genuinely the whole idea:
# "Builders and self-funders" (illustrative)
params:
  intensity_light:  0.35     # buildout comfortably self-funded
  intensity_heavy:  1.00     # capex eats all of operating cash flow
  accel_hot:        1.50     # capex up 50%+ on a year ago

features:
  ocf_ttm:          ttm(operating_cash_flow)
  capex_ttm:        ttm(capital_expenditures)
  fcf_ttm:          ttm(free_cash_flow)
  ni_ttm:           ttm(net_income)
  capex_intensity:  if(ocf_ttm > 0, capex_ttm / ocf_ttm, null)
  capex_accel:      if(lag(capex_ttm, 4) > 0, capex_ttm / lag(capex_ttm, 4), null)
  funding_gap:      ni_ttm > 0 and fcf_ttm < 0

criteria:
  self_funded:      # one direction: reward capex discipline
    - { when: "capex_intensity <= $intensity_light and fcf_ttm > 0", score: 2 }
    - { when: "capex_intensity <= $intensity_heavy and fcf_ttm > 0", score: 1 }
    - { else: 0 }
  building_hard:    # the other: isolate the aggressive builders
    - { when: "capex_accel >= $accel_hot and capex_intensity >= $intensity_heavy", score: 2 }
    - { when: "capex_accel >= $accel_hot", score: 1 }
    - { else: 0 }

gate:
  - ocf_ttm > 0     # the question is how cash gets spent, not whether any exists
  - min_market_cap
One craft note: you would not keep both criteria in one thesis, because they pull in opposite directions and the composite score would blur them. Save two copies instead. One thesis screens for self-funded cash generators, the classic quality-value tilt. The other isolates aggressive builders as a study population. Same features, opposite convictions, and the point is that both are now stated precisely enough to be graded.
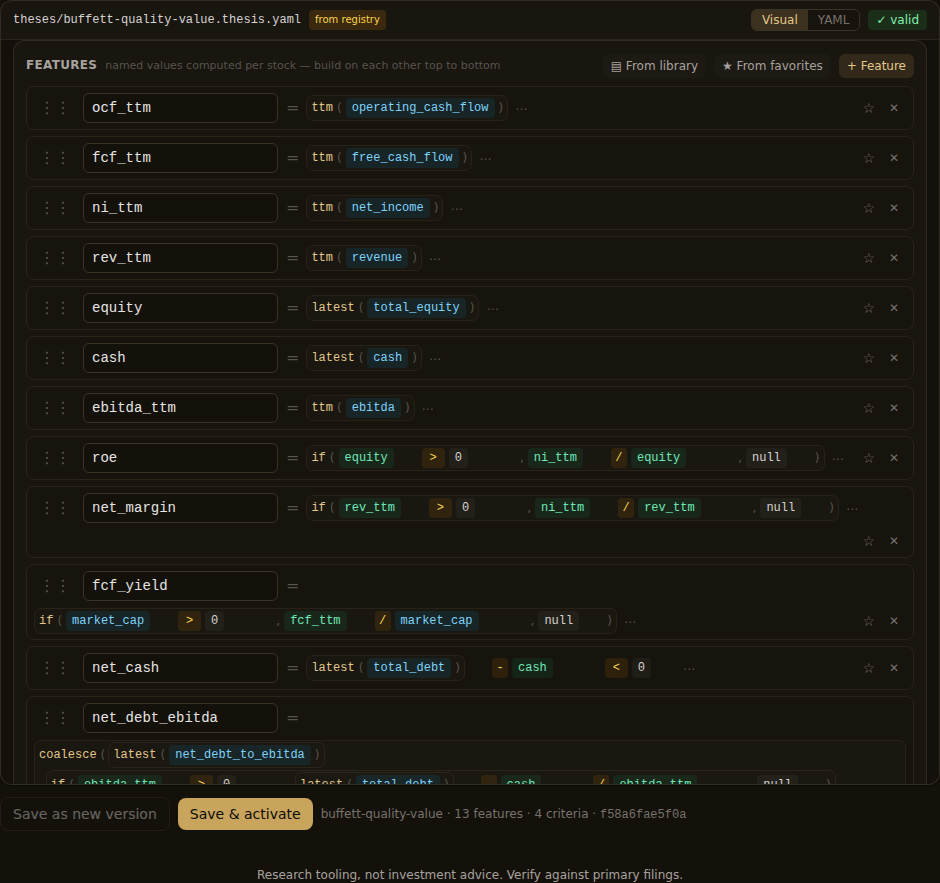
This is where composing features from raw fundamentals earns its keep. Open the Buffett Quality Value template and ocf_ttm and fcf_ttm are already there as plain definitions; capex_intensity is one more line, not a feature request to a screener vendor. The ratio at the center of this week's biggest financial story is not on anyone's dropdown menu, and it does not need to be.
What a backtest of capex intensity can and cannot settle
Run either thesis walk-forward and you get an honest historical record. Quantery's point-in-time SEC fundamentals support backtests from 2013, which matters here: that window contains the shale era, where outspending cash flow ended in tears, and the cloud buildout, where it did not. A period with both fates represented is the fairest test this idea can get. The results are hypothetical, exclude costs, and everything in what makes a backtest honest applies in full.
What would a good result establish? That companies matching this footprint, over that period, tended to outperform or underperform before costs. That is a real fact, and it beats the alternative, which is holding an opinion about the AI buildout on vibes.
What it cannot establish: whether this buildout resembles anything in the sample. Nothing in the 2013 window happened at this scale, with this concentration, at companies this profitable. A backtest is a record of how a footprint behaved in the past, not a verdict on the future, and the gap between those two is exactly where your judgment still has to live.
One more honesty note: the five hyperscalers themselves are a story, not a sample. Five names cannot support statistics. The screen's real value is the rest of the universe: the suppliers, utilities, data-center landlords, and industrial names whose capex is accelerating in sympathy, where the cohort is large enough for a backtest to mean something.
The bond market expressed its view this week, $115 billion of demand for one issuer. You do not have to share that view or fade it. You have a better option than either: state what you believe about capex and cash flow as rules, run the rules against the history, and let the record argue back. The rules are yours.
Research tooling, not investment advice. Nothing here is a recommendation to buy, sell, or hold any security. Screens, scores, and backtests are informational only; backtested results are hypothetical, exclude costs such as commissions and slippage, and do not guarantee future results. Verify against primary filings and make your own decisions.
Want to try this on your own rules? Quantery is free for 14 days: the full app, no card required.
← All articles