How to read clustered signals in a backtest
A clustered signal is a group of companies that qualify on the same rebalance date or within the same market episode. Those rows may share the rate move, commodity shock, sector recovery, or reporting cycle that produced them. The event count can look broad even though the evidence rests on one set of conditions.
Read the dates before you read the average. Group the go events into date cohorts, look for repeat entries by the same company, and compare the event study with the portfolio path. Then rerun the thesis across other periods, a neighboring rebalance cadence, and relevant sector exclusions. The question isn't whether the cluster should be deleted. It's whether the result travels beyond it.
Why don't clustered events count as independent evidence?
An event study asks what happened after each company newly passed the gate. In Quantery, a go event is a fresh transition from failing the quantitative gate to passing it. A company that remains above the gate at the next rebalance doesn't create another event. If it drops out and later qualifies again, it can create a new one. The first-backtest walkthrough explains that distinction and the entry mechanics behind the saved report.
The n beside a forward horizon counts measurable events. It doesn't claim that every row is an independent experiment. Suppose a group of industrial companies qualifies after the same change in financing conditions. Their subsequent returns can share a common driver. Adding the rows increases n, but it hasn't added the same amount of new information as signals drawn from unrelated periods.
This is called cross-sectional dependence: outcomes for different companies move together because they share an exposure. The formal event-study literature has a blunt warning here. Kolari and Pynnönen find that when event dates cluster, even modest cross-correlation in abnormal returns can make conventional tests reject the no-effect hypothesis too often (The Review of Financial Studies). Quantery's horizon summaries are descriptive, so the practical lesson is straightforward. Don't turn a row count into a claim about independent trials.
Overlapping forward windows add another layer. Signals from nearby rebalances may be measured across much of the same market path. If all of them encounter the same rally or selloff, the horizon result partly describes that shared path. A longer list doesn't create more calendar history.
What does a cluster look like in the report?
Open the saved backtest and inspect Go events. The date column is the quickest diagnostic. A run with a steady trickle across many periods tells a different story from a run whose events arrive in a few dense blocks.
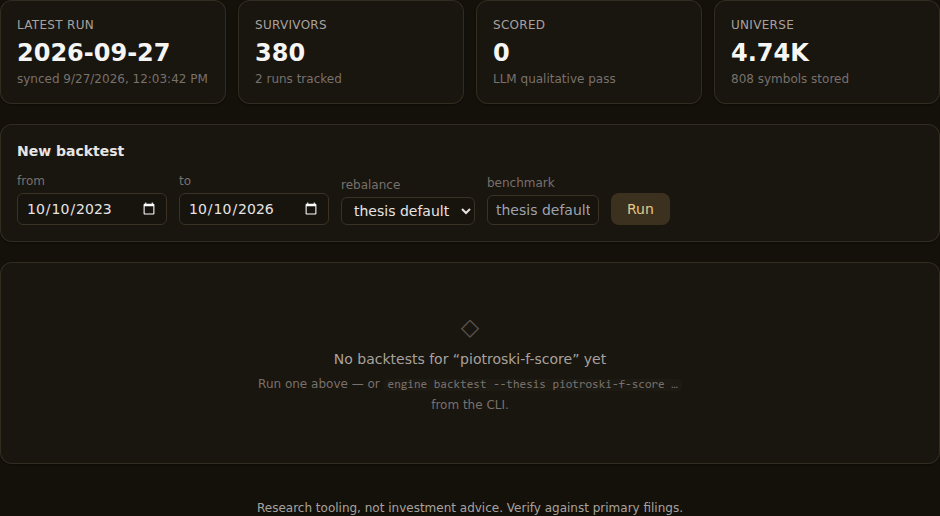
Call every group on one rebalance date a cohort. For each large cohort, record what the thesis could see at that point:
- Which criteria changed for the entrants?
- Did one sector supply much of the cohort?
- Were the companies exposed to the same economic driver?
- Had several names crossed a hard cutoff by a narrow margin?
- Did the same symbols appear again after brief gate failures?
The rebalance schedule matters. A monthly thesis only checks at its monthly observation points, so filings released throughout the month can appear together on the next evaluation date. That bunching may come from the clock as well as the economy. Switch to a neighboring cadence with the thesis version and date range held fixed. If the same economic group still qualifies around the same period, the cluster has substance. If the burst breaks into repeated threshold crossings, the clock and gate deserve more attention. Rebalance cadence is an observation choice, not background plumbing.
Repeat entries need their own mark in the research log. They aren't duplicate rows by accident. Each says the company failed and then recovered enough to pass again. But several entries from one company still expose the study to that company's path more than once. Read a company-level count beside the event count. If the conclusion weakens when you consider only the earliest qualification per company, recurrence was carrying part of the evidence.
How should the event study and portfolio be compared?
The event study gives each go event a place in the horizon summary. The naive portfolio answers a different question: what happened when qualifying companies became equal-weight positions under the stored entry and exit rules? A same-date cohort can create many event rows while occupying one stretch of portfolio time.
That difference is useful. If the event study looks strong but the portfolio lags its benchmark, inspect whether the large cohorts crowded capital into one sector or entered just before a common reversal. Check the mean against the median too. A high mean with a weaker median can show that a few outcomes carried the cohort. Reading the backtest report from coverage upward keeps those summaries attached to their assumptions.
If the portfolio and event study agree, the cluster still matters. Agreement says the signal and the holding policy told a similar historical story. It doesn't show that the story repeated across unrelated environments. Backtested returns remain hypothetical and exclude costs. A crowded cohort of thinly traded companies may be harder to implement than an equal-weight curve suggests.
Don't merge the two views into a homemade score. Write separate claims instead:
- Event claim: new qualifications tended to beat or lag the benchmark over the chosen horizon.
- Policy claim: the stored entry and exit rules produced the recorded compounded path.
- Dependence claim: much of the evidence arrived in a named set of cohorts, sectors, or recurring companies.
That last line prevents a broad-sounding conclusion from outrunning the history that produced it.
Which reruns reveal cluster dependence?
Start with the cheapest challenge: split the history around the dominant episode. Run the same saved thesis version before the cluster, through the later period, and over the full covered range. Don't demand matching returns. Ask whether the direction, median, and portfolio relationship survive when the prominent cohort can't carry every window.
Next, change the observation clock. Preserve the gate, benchmark, reporting lag, and exit settings. A nearby cadence tells you whether qualification is a durable state or a brief crossing that happened to line up with one rebalance date. If churn appears, stress-test the exit rule and inspect the cutoff before crediting the business mechanism.
Then challenge shared exposures. If one industry dominates the event burst, make a copy of the thesis, exclude that industry, and rerun the same dates. Follow with the mirror test on that industry alone. The broad version asks whether the idea travels; the narrow version tells you whether the original result was chiefly an industry result. The sector-bet test lays out the leave-one-sector-out logic.
Company recurrence gets a different check. Review the event list grouped by symbol and note the first qualification, later re-entry dates, and the criteria that flickered. A thesis whose result relies on frequent re-entry may be measuring noise around a threshold. Widening a scoring band or requiring a more decisive gate can test that explanation. Make the change because it fits the thesis, then preserve the failed version too.
Finally, reserve untouched time. A thesis can survive every rearrangement of one famous episode because each variation still uses that episode. Freeze the rules and carry them into a holdout period. If the next block produces qualifiers under different conditions and the direction survives, the claim has traveled. If the holdout stays empty, you learned that the thesis may describe a rare setup. That's useful, but it isn't broad evidence.
When is a cluster part of the thesis?
Sometimes bunching is exactly what the mechanism predicts. A refinancing-pressure thesis should react when financing conditions tighten. A cyclical inventory thesis may wake up when an industry turns. Forcing those signals into an even calendar distribution would erase the phenomenon you're trying to study.
In that case, change the claim. Say the thesis identified companies during a particular kind of episode, then test several such episodes separately. Treat the episode as the unit of evidence. A large cohort inside one cycle remains one cycle. More companies can show that the mechanism reached across firms, but they can't supply another cycle.
A bottom-up quality thesis deserves more suspicion when it fires in one burst. The cluster may reveal an unplanned macro exposure, a common reporting artifact, or a threshold that many companies crossed together. None of those explanations is fatal. Each one calls for a different rerun, which is why the event dates belong in the diagnosis instead of beneath the headline return.
The rules are yours, and so is the unit of evidence. Count events to describe what the engine measured. Count companies to expose recurrence. Count distinct periods to judge whether the result traveled. Then make the conclusion no wider than the history.
Research tooling, not investment advice. Nothing here is a recommendation to buy, sell, or hold any security. Screens, scores, and backtests are informational only; backtested results are hypothetical, exclude costs such as commissions and slippage, and do not guarantee future results. Verify against primary filings and make your own decisions.
Want to try this on your own rules? Quantery is free for 14 days: the full app, no card required.
← All articles