How to run your first backtest in Quantery
A useful first backtest doesn't answer whether a thesis is good. It answers whether the rules, applied through time with only the information then available, produced a result worth testing harder. In Quantery, pick an editable thesis, choose the dates, cadence, and benchmark, run it, then read the coverage note before the return.
That order matters. A handsome equity curve can come from a thin historical universe or a benchmark that doesn't fit the thesis. Your first run is a baseline, so keep the setup plain and preserve it. You'll change one assumption at a time after you understand what the baseline saw.
Which thesis should you test first?
Start with a thesis you can explain without reopening the editor. Piotroski F-Score is a useful teaching case because each point comes from a concrete change in the financial statements. If you haven't met the score yet, the Piotroski F-score walkthrough maps its profitability, funding, and efficiency signals.
Open the Piotroski F-Score template and read its gate. Quantery's bundled version uses the quantitative signals the local data can replay through history. The qualitative criteria don't enter the backtest because there isn't a point-in-time archive of every web page and judgment an assistant would have used. The finished report says this directly.
Run a scan first if the thesis is still unfamiliar. A scan tells you what passes now, and auditing a scan result shows how to trace each score to the filing inputs behind it. The backtest takes the same quantitative evaluator through earlier dates. If you can't defend today's rule, running it through yesterday won't improve it.
Don't edit the template for this first pass. The goal is to learn the report with a known version. Parameter work comes next, when a changed result can be tied to one changed rule.
What should you enter for the first run?
Use a recent window where your local data has meaningful breadth. Quantery's point-in-time SEC fundamentals support backtests from 2013, while price depth depends on the user's market-data plan. That makes the earliest possible date a poor automatic choice. A shorter, well-covered baseline teaches more than a long run whose first stretch saw few eligible companies.
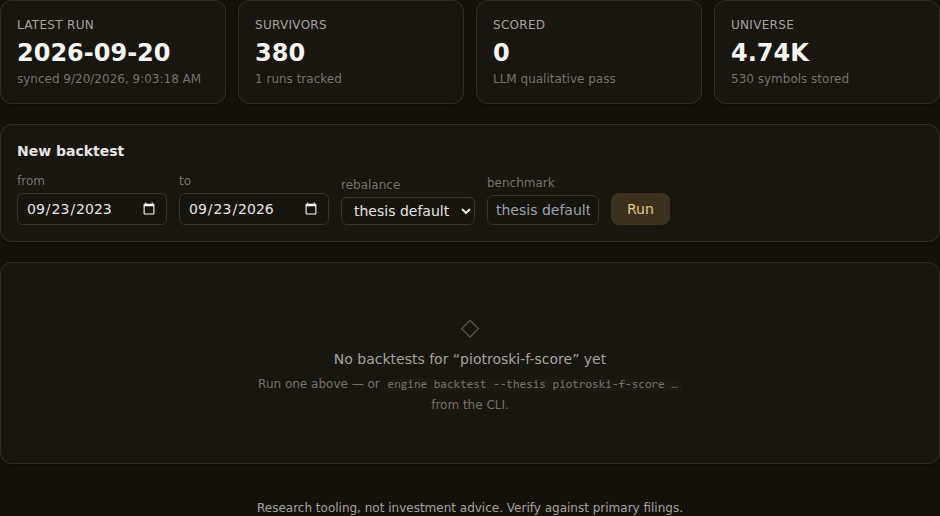
The new-backtest controls ask for three decisions:
- From and to: the period over which the thesis is reevaluated.
- Rebalance: how often the engine gets a chance to evaluate the rules. Leave the thesis default for the baseline.
- Benchmark: the passive alternative used to calculate excess returns. Leave the thesis default unless its universe makes that comparison implausible.
Quantery records the active thesis version with the saved report, so later edits don't rewrite the run you just made.
A rebalance schedule is an observation clock. It isn't an instruction to sell everything at each date. Filing-driven rules often suit a monthly clock because the decisive inputs change when companies report. Price-sensitive rules can justify a weekly check. Choosing a backtest rebalance schedule covers the difference between checking, holding, and exiting.
The benchmark deserves a sentence in your research notes before you press Run. SPY can be a sensible baseline for a broad US large-company thesis. A thesis aimed at much smaller companies needs a closer alternative. Matching the benchmark to the thesis universe explains the benchmark ladder. For a first pass, keep the stored default if it's defensible and record why.
Then run the backtest. If another data job, scan, or backtest holds the single lake writer, this one queues. The queue banner's Run next button can promote it. Waiting doesn't change the test.
What happens during a Quantery backtest?
At each rebalance date, the engine builds the market as it could have been seen then. It uses filing availability, not the fiscal period's ending date, and evaluates the thesis against that point-in-time frame. A report filed after the simulated date stays in the future.
A go event occurs when a company newly passes the quantitative gate. Staying above the gate at the next rebalance doesn't create another event. Falling out and later qualifying again can. This distinction matters because the event study follows fresh qualifications, while the portfolio keeps track of positions under the entry and exit rules.
New positions enter at the next trading day's close. The engine then follows the thesis's maximum-hold and gate-fail settings. A company that stops trading receives the run's pessimistic delisting treatment. These mechanics turn a sequence of historical evaluations into two different outputs: an event study and a naive portfolio.
That historical frame has limits. Before an install has recorded its own daily universe snapshots, membership may need reconstruction. Quantery retains companies that are present in the historical lake, but a reconstructed proxy can still be incomplete and skew optimistic. Read what this particular run says instead of assuming the date range guarantees breadth.
How should you read the finished report?
Start at the bottom of the event-study card. Read the coverage warning and note. Then read the average universe and rebalance count. These lines tell you whether the engine had an investable population throughout the chosen window and whether it used recorded membership or a fallback. If early dates are empty or sparse, narrow the period or backfill data. A zero return from an empty universe means the test never invested.
Now read the event study. It asks: after each new qualification, how did that company perform relative to the benchmark over each forward horizon?
- n is the number of go events with enough subsequent history for that horizon.
- hit is the share that beat the benchmark.
- mean is the average excess return. One enormous winner can pull it upward.
- median is the middle excess return after sorting the events. It describes the typical event better when the tails are wild.
The value of n usually falls at longer horizons because recent events haven't had time to mature. Don't compare a short-horizon row and a long-horizon row as if they contain the same evidence. Open the go-event list when an aggregate surprises you. Repeated events from one company and events crowded into one market episode aren't independent observations.
Next read the portfolio. Quantery's naive portfolio enters qualifying companies at the defined next close and weights the positions equally. Its curve folds together the gate, cadence, entries, exits, and concentration. The benchmark curve gives the passive baseline over that run. Maximum drawdown shows the largest peak-to-trough decline in the simulated strategy.
The event study and portfolio can disagree without either calculation being broken. They weight events and time differently. If the portfolio wins while the typical event loses, investigate concentration and timing. If both point the same way across several horizons, the thesis has earned another run. It hasn't earned a conclusion yet.
What can't the first report establish?
Every return in the report is hypothetical and excludes trading costs. Spreads and slippage can matter badly when a thesis reaches thinly traded companies. The engine can model its rules; it can't promise fills at the displayed close.
The report also doesn't establish causality. A winning result may be a small-company cycle, a sector tilt, one market regime, or a few outsized positions. The benchmark reduces one source of confusion, but no single comparison removes them all.
Historical membership before recorded snapshots can be approximate, and the qualitative layer isn't replayed. Those aren't footnotes to clear away. They define the claim. This run tested the quantitative gate on the market data and membership the coverage panel describes.
Finally, the settings have seen the result once you've looked. If you now tune every threshold until the curve improves, the same history becomes both workshop and exam. Write down the next change before you run it.
What should the second backtest change?
Change one thing. For a filing-driven thesis, switch between monthly and weekly rebalancing while preserving the version, dates, and benchmark. Or keep the cadence and move the start date. If the result's direction flips, the changed assumption is carrying more of the answer than you thought.
After that, test one round parameter near the gate. The rules are yours, which means the burden is yours too: explain why the new threshold belongs in the business claim before seeing its curve. Testing whether a backtest result survives perturbation gives the full one-dial workflow.
Save the bad runs. Quantery keeps each completed report with its thesis version and settings, so a weak result doesn't need to disappear. A row of failed variants can tell you that the idea depends on one period or one arbitrary cutoff. That's research doing its job.
Your first backtest is a reference point. Read coverage first, compare events with the portfolio, and carry the caveats into the claim you write down. Then change one rule and ask again. The curve is an output. The reusable work is the sequence of questions you make it answer.
Research tooling, not investment advice. Nothing here is a recommendation to buy, sell, or hold any security. Screens, scores, and backtests are informational only; backtested results are hypothetical, exclude costs such as commissions and slippage, and do not guarantee future results. Verify against primary filings and make your own decisions.
Want to try this on your own rules? Quantery is free for 14 days: the full app, no card required.
← All articles